Amara, ingeniería de marketing

Author: Salvador Galindo

  • Matriz de impacto-probabilidad: prioriza tu DAFO con precisión

    Matriz de impacto-probabilidad: prioriza tu DAFO con precisión

    Hacer un DAFO es relativamente sencillo. El verdadero reto llega después: tienes una lista de amenazas y oportunidades, pero no sabes por cuál empezar. Ahí es donde entra en juego la matriz de impacto-probabilidad, una herramienta que convierte ese listado en una hoja de ruta clara, ordenada por lo que realmente importa.

    ¿Qué es la matriz de impacto-probabilidad?

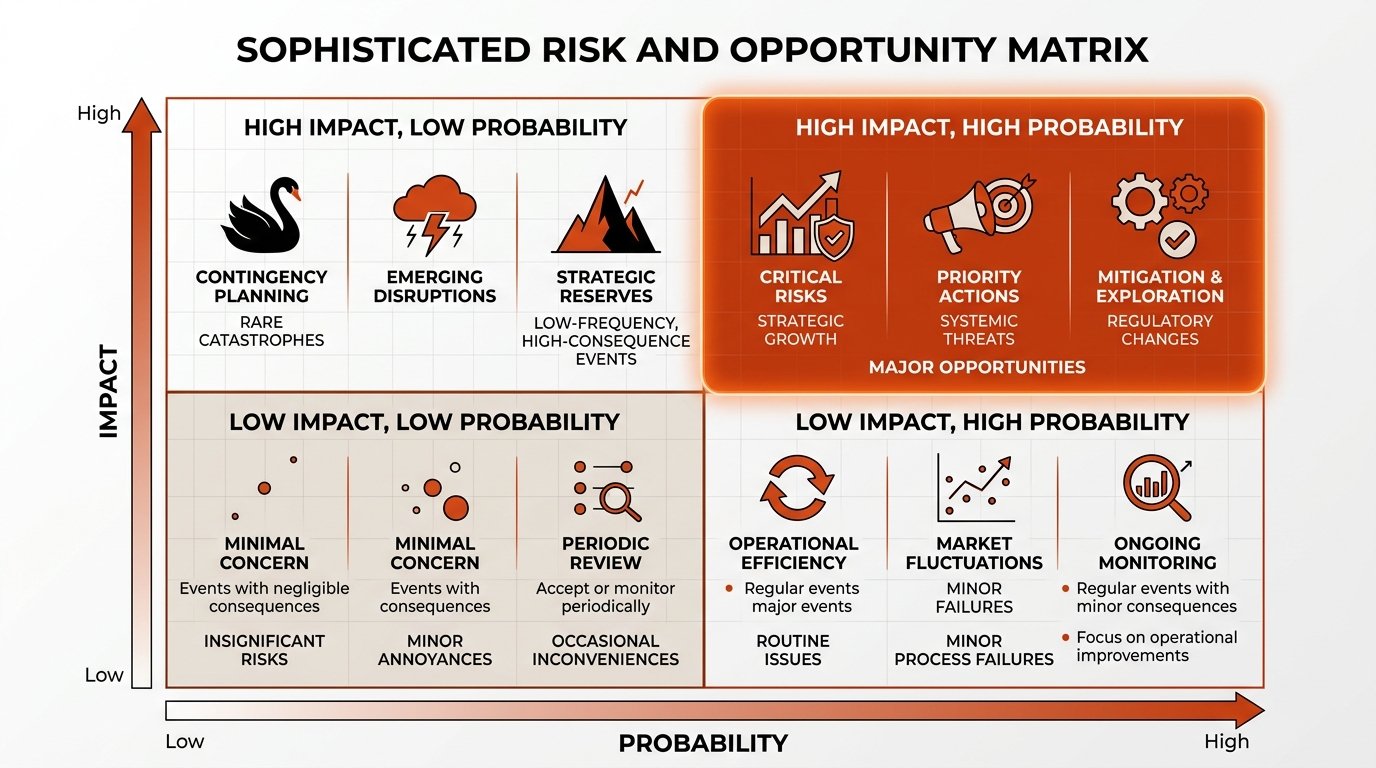
    La matriz de impacto-probabilidad es una herramienta de análisis y priorización que sitúa cada factor estratégico —amenaza u oportunidad— en un plano de dos ejes: el impacto potencial que tendría si se materializase y la probabilidad de que ocurra. El resultado es una cuadrícula 2×2 que separa lo urgente de lo secundario de un vistazo.

    En esencia, responde a una pregunta muy concreta: de todo lo que has identificado en tu análisis DAFO, ¿qué merece tu tiempo y tus recursos ahora mismo? Sin esta criba, es habitual que los equipos dediquen energía a riesgos remotos mientras descuidan oportunidades con alta probabilidad de éxito. La cuadrícula de impacto-probabilidad pone orden en esa toma de decisiones.

    Aunque su uso más extendido es en gestión de riesgos corporativos —la norma ISO 31000 la recoge como técnica estándar de evaluación de riesgos—, su lógica es igualmente válida para priorizar el DAFO de una pyme, un proyecto de marketing o el lanzamiento de un producto. Cualquier escenario donde haya múltiples factores externos compitiendo por tu atención es terreno fértil para este análisis de priorización mediante la matriz de impacto-probabilidad.

    ¿Por qué el DAFO solo no es suficiente?

    El análisis DAFO es un punto de partida excelente: te obliga a mirar hacia dentro (fortalezas y debilidades) y hacia fuera (amenazas y oportunidades). Sin embargo, su formato habitual —cuatro cuadrantes con listas de ítems— tiene un problema estructural: trata todos los factores como si tuviesen el mismo peso.

    Imagina que tu DAFO recoge ocho amenazas. ¿Cuál abordas primero? Sin un criterio de priorización, la respuesta suele ser subjetiva: la que más preocupa al director, la que se mencionó más veces en la reunión o, sencillamente, la primera de la lista. Ninguna de esas razones es estratégica.

    La matriz de impacto-probabilidad complementa el DAFO aportando exactamente lo que le falta: un criterio objetivo y visual para ordenar la acción. No sustituye al análisis, lo hace accionable. Por eso se habla de ella como el «segundo paso» del DAFO, el que convierte el diagnóstico en estrategia. Aplicar esta matriz de impacto-probabilidad justo después del DAFO es la práctica más habitual en equipos con experiencia en planificación estratégica.

    ¿Cómo se construye la matriz paso a paso?

    Construir tu propia cuadrícula no requiere software especializado ni formación técnica. Basta con papel, una hoja de cálculo o cualquier herramienta de pizarra colaborativa. El proceso tiene cinco pasos bien definidos.

    Paso 1: recopila los factores del DAFO

    Toma la lista de amenazas y oportunidades que has identificado en tu análisis DAFO. No filtres todavía: incluye todos los ítems, aunque algunos parezcan poco relevantes a primera vista. La matriz de impacto-probabilidad se encargará de depurarlos.

    Si tu DAFO está incompleto o es demasiado genérico, este es el momento de revisarlo. Un factor bien definido —”el proveedor principal puede subir precios un 20% en los próximos seis meses”— es mucho más fácil de valorar en la matriz de impacto-probabilidad que uno vago como “problemas con proveedores”.

    Paso 2: puntúa el impacto de cada factor

    Para cada amenaza u oportunidad, asigna una puntuación de impacto. Puedes usar una escala del 1 al 5 o del 1 al 10, según la granularidad que necesites. Lo importante es que el equipo comparta el mismo criterio: ¿impacto sobre qué? Puede ser sobre ingresos, cuota de mercado, reputación o continuidad del negocio, dependiendo de tu contexto.

    Evita la trampa de puntuar el impacto en abstracto. Ancla la valoración a consecuencias concretas: “si esto ocurre, ¿cuánto afecta a nuestros objetivos del año?” Esa pregunta concreta reduce la subjetividad y facilita el consenso en el equipo. Este paso previo es el que más se salta y el que más distorsiona el resultado: sin él, la matriz de impacto-probabilidad refleja opiniones, no análisis.

    Paso 3: puntúa la probabilidad de ocurrencia

    Con la misma escala, valora la probabilidad de que cada factor se materialice en el horizonte temporal que hayas definido (habitualmente, 12 o 24 meses). Basa esta valoración en evidencias: tendencias del mercado, datos históricos, señales del entorno competitivo.

    Si no tienes datos, usa el juicio experto del equipo de forma estructurada: que cada persona puntúe de forma independiente y luego se debata la media. Este proceso, inspirado en el método Delphi —una técnica de consenso experto desarrollada por la RAND Corporation en los años cincuenta y ampliamente documentada en literatura de gestión estratégica—, reduce el sesgo de anclaje que suele aparecer cuando alguien con autoridad dice su número primero. Es especialmente útil cuando la matriz de impacto-probabilidad se construye con equipos multidisciplinares.

    Paso 4: sitúa cada factor en la cuadrícula

    Dibuja los dos ejes: probabilidad en el eje horizontal e impacto en el eje vertical. Divide cada eje en dos zonas (alto/bajo) para obtener los cuatro cuadrantes. Ahora coloca cada factor según sus puntuaciones. El resultado visual es inmediato: los factores del cuadrante superior derecho —alta probabilidad, alto impacto— son tu prioridad número uno en la matriz de impacto-probabilidad.

    Si usas una escala numérica, puedes calcular un índice combinado multiplicando impacto por probabilidad y ordenar los factores de mayor a menor. Esto es especialmente útil cuando hay muchos ítems y la cuadrícula se satura.

    Paso 5: define acciones por cuadrante

    La herramienta no es un fin en sí misma: su valor está en las decisiones que genera. Para cada cuadrante de la matriz de impacto-probabilidad, el tipo de respuesta estratégica es diferente. En el siguiente apartado lo detallamos.

    ¿Cómo interpretar los cuatro cuadrantes?

    Cuatro cuadrantes de la matriz DAFO mostrando acciones prioritarias, planes de contingencia, monitoreo y vigilancia según

    Cada cuadrante de la matriz de impacto-probabilidad sugiere una actitud estratégica distinta. Conocerlos te permite asignar recursos con lógica, no con intuición.

    Los cuatro cuadrantes de la matriz de impacto-probabilidad
    Cuadrante Impacto / Probabilidad Estrategia recomendada
    Actuar ya Alto / Alta Plan de acción inmediato con recursos dedicados
    Monitorizar de cerca Alto / Baja Plan de contingencia listo; revisión periódica
    Gestionar con eficiencia Bajo / Alta Procedimientos estándar; no consumir recursos extra
    Aceptar o ignorar Bajo / Baja Registrar y revisar anualmente; no actuar ahora

    El cuadrante de «Actuar ya» es el corazón de la herramienta. Los factores que caen aquí —sean amenazas o oportunidades de alto impacto— deben tener un responsable, un plazo y un presupuesto asignados antes de que la reunión estratégica termine. Sin ese compromiso, el ejercicio se convierte en estética.

    El cuadrante de «Monitorizar de cerca» es el más traicionero. Un riesgo de alto impacto pero baja probabilidad puede parecer secundario, pero si la probabilidad sube —por un cambio regulatorio, por ejemplo— puede escalar al cuadrante crítico de la matriz de impacto-probabilidad en cuestión de semanas. Por eso necesita un plan de contingencia preparado, aunque no activado.

    Los factores de «Gestionar con eficiencia» son frecuentes pero manejables. No merecen recursos extraordinarios, pero sí procesos claros para que no consuman atención directiva de forma innecesaria. Piensa en ellos como el mantenimiento rutinario de tu estrategia.

    Finalmente, los factores del cuadrante de «Aceptar o ignorar» son los que más equipos suelen sobrevalorar. Dedicarles tiempo y dinero es un error clásico de priorización. La matriz de impacto-probabilidad te da permiso explícito para aparcarlos, lo que libera capacidad para lo que realmente importa.

    Ejemplo práctico: la agencia de marketing completada

    Veamos cómo quedaría la cuadrícula rellena con un caso real. Supón que gestionas una pequeña agencia de marketing digital y tu DAFO ha identificado estas amenazas y oportunidades. Aplicar la matriz de impacto-probabilidad a este escenario permite visualizar de inmediato qué requiere acción y qué puede esperar:

    • Entrada de grandes consultoras en el segmento de pymes con precios muy competitivos.
    • Cambio en el algoritmo de Google que penalice el contenido generado sin supervisión humana.
    • Posible recesión económica que reduzca los presupuestos de marketing de los clientes.
    • Demanda creciente de contenido de vídeo corto entre tus clientes actuales.
    • Posibilidad de expansión a mercados latinoamericanos.
    Cuadrícula completada: agencia de marketing digital
    Factor Impacto (1-5) Probabilidad (1-5) Cuadrante
    Cambio algoritmo Google 5 5 Actuar ya
    Demanda de vídeo corto 4 5 Actuar ya
    Entrada de grandes consultoras 4 2 Monitorizar de cerca
    Expansión a Latinoamérica 5 2 Monitorizar de cerca
    Posible recesión económica 3 3 Gestionar con eficiencia

    Este ejercicio, que en papel parece abstracto, cambia radicalmente cómo el equipo distribuye su energía durante los próximos meses. El cambio de algoritmo y la oportunidad del vídeo comparten cuadrante prioritario: ambos necesitan responsable, plazo y presupuesto esta semana. La expansión latinoamericana, a pesar de su enorme potencial, espera hasta que la probabilidad de ejecución mejore. Esa es la propuesta de valor real de la matriz de impacto-probabilidad: no solo ordenar la lista, sino justificar con criterios objetivos por qué unas decisiones van antes que otras.

    ¿Qué errores debes evitar al usar esta herramienta?

    Errores comunes en la matriz de impacto-probabilidad: confundir urgencia con impacto, no actualizar datos y olvidar riesgos

    La matriz de impacto-probabilidad es una herramienta poderosa, pero su efectividad depende de cómo se aplica. Estos son los errores más frecuentes que conviene evitar.

    Puntuar sin criterio compartido

    Si cada miembro del equipo entiende «impacto» de forma diferente, las puntuaciones serán incomparables. Antes de empezar, define explícitamente qué significa cada nivel de la escala. Por ejemplo: impacto 5 = afecta a más del 30% de los ingresos anuales; impacto 1 = no tiene consecuencias medibles en los objetivos del año. Sin ese acuerdo previo, la matriz de impacto-probabilidad refleja opiniones, no análisis.

    Actualizar la matriz solo una vez al año

    El entorno cambia. Una amenaza que en enero tenía baja probabilidad puede volverse inminente en julio. La priorización del DAFO mediante esta cuadrícula de impacto-probabilidad debe revisarse al menos trimestralmente, o cada vez que se produzca un cambio significativo en el mercado, la regulación o la competencia. Tratar la cuadrícula como un documento estático la convierte en papel mojado.

    Incluir demasiados factores

    Si la cuadrícula tiene más de diez o doce ítems, pierde claridad visual y operativa. Si tu DAFO tiene muchos factores, agrúpalos en categorías antes de puntuarlos en la matriz de impacto-probabilidad. La utilidad de la herramienta está en la síntesis, no en la exhaustividad.

    No asignar responsables a los cuadrantes prioritarios

    Una cuadrícula sin responsables es una lista de buenas intenciones. Cada factor del cuadrante «Actuar ya» debe tener un nombre, una fecha límite y, si es posible, un indicador de seguimiento. Sin esa asignación, la priorización que ofrece la matriz de impacto-probabilidad queda en el plano teórico.

    ¿Cuándo usar la matriz de impacto-probabilidad frente a otras herramientas?

    La matriz de impacto-probabilidad no es la única herramienta de priorización disponible. Elegir la más adecuada depende del tipo de decisión que tengas que tomar y del contexto en el que operas. Esta comparativa te ayuda a decidir.

    Matriz de impacto-probabilidad vs. matriz de Eisenhower

    La matriz de Eisenhower clasifica tareas según urgencia e importancia, y está pensada para la gestión del tiempo individual o de equipo. La matriz de impacto-probabilidad, en cambio, opera a nivel estratégico: evalúa factores externos del entorno, no tareas internas. Úsalas de forma complementaria: primero la cuadrícula de impacto-probabilidad para identificar qué factores del DAFO son prioritarios; luego Eisenhower para organizar las tareas que derivan de esa priorización.

    Matriz de impacto-probabilidad vs. método MoSCoW

    MoSCoW (Must have, Should have, Could have, Won’t have) es una técnica de priorización de requisitos muy usada en gestión de proyectos ágiles. Su fortaleza es la rapidez y la claridad para el equipo de desarrollo. Sin embargo, no incorpora probabilidad: clasifica por importancia percibida, no por verosimilitud de ocurrencia. La matriz de impacto-probabilidad es más adecuada cuando los factores son inciertos y el entorno es volátil.

    Matriz de impacto-probabilidad vs. análisis PESTEL

    El análisis PESTEL identifica factores del macroentorno (políticos, económicos, sociales, tecnológicos, ecológicos y legales), pero no los ordena por relevancia. La combinación natural es PESTEL → DAFO → matriz de impacto-probabilidad: el PESTEL alimenta el DAFO con factores externos, y la cuadrícula de impacto-probabilidad decide cuáles merecen acción inmediata. Son herramientas secuenciales, no alternativas.

    Matriz de impacto-probabilidad vs. matriz de Ansoff

    La matriz de Ansoff responde a una pregunta diferente: ¿en qué dirección crecer? (penetración, desarrollo de producto, desarrollo de mercado o diversificación). No es una herramienta de priorización de riesgos, sino de dirección estratégica. Úsalas en secuencia: la matriz de impacto-probabilidad te dice qué oportunidades activar primero; Ansoff te dice cómo crecer a partir de ellas.

    Variantes de la matriz para equipos con mayor madurez analítica

    La versión 2×2 de la matriz de impacto-probabilidad es el punto de entrada, pero existen variantes que añaden granularidad cuando el equipo ya domina la herramienta básica.

    Versión 3×3 y 5×5

    Ampliar la cuadrícula a tres o cinco niveles por eje permite diferenciar factores que en la versión básica quedarían en el mismo cuadrante. Una matriz 5×5 de impacto-probabilidad es especialmente útil en gestión de riesgos corporativos con muchos factores similares: el índice combinado (impacto × probabilidad) puede ir de 1 a 25, lo que facilita la ordenación precisa. El coste es mayor complejidad en el proceso de puntuación.

    Versión cuantitativa con índice de riesgo ponderado

    En lugar de una escala ordinal, algunos equipos asignan valores monetarios o porcentuales al impacto (p. ej., “pérdida estimada de 50.000 €”) y probabilidades estadísticas (p. ej., “30% de ocurrencia en 12 meses”). El valor esperado —impacto monetario × probabilidad— permite ordenar los factores con precisión matemática y comparar el coste de mitigar cada riesgo frente al coste de no hacerlo. Esta variante de la matriz de impacto-probabilidad requiere más datos, pero es la que usan los equipos de gestión de riesgos en sectores regulados.

    ¿Cuándo tiene más sentido usar la matriz de impacto-probabilidad?

    Esta herramienta encaja especialmente bien en cuatro contextos:

    • Planificación estratégica anual: justo después de completar el DAFO, como segundo paso natural antes de definir objetivos. La matriz de impacto-probabilidad convierte esa lista en una agenda de acción concreta.
    • Gestión de crisis o incertidumbre: cuando el entorno cambia rápido y necesitas decidir qué atender primero con recursos limitados.
    • Lanzamiento de productos o servicios: para priorizar los riesgos e identificar las oportunidades de mayor retorno antes de invertir. Una matriz de impacto-probabilidad construida en esta fase evita que el equipo persiga señales de mercado de bajo valor.
    • Revisiones de negocio trimestrales: como herramienta de chequeo para verificar si las prioridades siguen siendo las mismas o han cambiado.

    Por el contrario, si tu análisis DAFO es muy superficial o los factores identificados son demasiado vagos, la cuadrícula no añadirá valor: el problema está aguas arriba, en la calidad del diagnóstico. La matriz de impacto-probabilidad amplifica la calidad del DAFO que la alimenta: si el input es pobre, el output también lo será.

    En definitiva, la matriz de impacto-probabilidad es el puente entre el diagnóstico y la acción estratégica. Convierte el DAFO en una herramienta viva, capaz de orientar decisiones concretas en lugar de quedarse enmarcado en una presentación. Si ya tienes tu análisis DAFO listo, este es el siguiente paso lógico: puntúa, sitúa en la cuadrícula y actúa donde más importa.

    Preguntas frecuentes

    ¿La matriz de impacto-probabilidad sirve solo para amenazas o también para oportunidades?

    Sirve para ambas. Aunque históricamente se asocia a la gestión de riesgos, la lógica de cruzar impacto y probabilidad es igualmente válida para priorizar oportunidades del DAFO. De hecho, una oportunidad de alto impacto y alta probabilidad merece la misma atención urgente que una amenaza crítica.

    ¿Cuántos factores debería incluir en la matriz?

    Lo ideal es trabajar con entre cinco y doce factores por análisis. Con menos de cinco, la priorización es trivial. Con más de doce, la cuadrícula pierde claridad visual y operativa. Si tu DAFO tiene muchos ítems, agrúpalos en categorías temáticas antes de puntuarlos en la matriz de impacto-probabilidad.

    ¿Con qué frecuencia debo actualizar la matriz?

    Como mínimo, una vez por trimestre. También deberías revisar el análisis de priorización cada vez que se produzca un cambio significativo en el entorno: una nueva regulación, la entrada de un competidor relevante, un cambio tecnológico o una crisis sectorial. La matriz de impacto-probabilidad es un documento vivo, no un entregable puntual.

    ¿Qué escala de puntuación es mejor: del 1 al 3, del 1 al 5 o del 1 al 10?

    Depende de la granularidad que necesites. Para la mayoría de pymes y equipos de marketing, una escala del 1 al 5 ofrece suficiente diferenciación sin complicar el proceso. Las escalas del 1 al 10 son útiles cuando hay muchos factores similares que necesitan separarse con precisión. Lo más importante no es la escala elegida, sino que todo el equipo la interprete igual.

    ¿Existe una plantilla para construir la matriz de impacto-probabilidad?

    Sí. Puedes replicar la cuadrícula fácilmente en Google Sheets: crea una tabla con columnas para el factor, la puntuación de impacto (1-5), la puntuación de probabilidad (1-5) y una columna calculada con el índice combinado (impacto × probabilidad). Ordena por ese índice de mayor a menor para obtener tu lista de prioridades. Para la representación visual, usa un gráfico de dispersión XY con los ejes de impacto y probabilidad. No necesitas software especializado para construir tu propia matriz de impacto-probabilidad.

    ¿Puedo combinar la matriz de impacto-probabilidad con otras herramientas estratégicas?

    Sí, y es recomendable. La combinación más habitual es DAFO + matriz de impacto-probabilidad + matriz de Ansoff (para decidir la dirección de crecimiento). También se usa junto a la matriz de Eisenhower para priorizar tareas derivadas de los factores críticos. Cada herramienta responde a una pregunta distinta; combinarlas da una visión más completa.

  • How to Choose an SLM and Deploy It in Your Project Step by Step

    How to Choose an SLM and Deploy It in Your Project Step by Step

    Choosing an SLM —a Small Language Model— is one of the most relevant technical decisions you can make when you want to integrate AI into a project without depending on external APIs or incurring exorbitant costs. Knowing how to choose an SLM correctly involves evaluating specific technical criteria, knowing the available tools and following an orderly implementation process. This guide takes you from the decision to deployment, including advanced patterns such as RAG and fine-tuning.

    What is an SLM and why does choosing it well matter?

    An SLM is an artificial intelligence model capable of processing and generating natural language with far fewer resources than a conventional LLM. Small language models perform specific tasks with fewer resources, making them the natural option for projects with hardware, privacy or budget constraints. Choosing an SLM appropriately directly determines the viability of the project.

    Unlike generalist LLMs, SLMs are usually designed with specific use cases in mind, which allows prioritizing efficiency, speed and control. In well-defined tasks —text classification, data extraction, internal assistants, content moderation—, a well-chosen model can outperform in practical terms a large one that is poorly adjusted. That is why knowing how to choose an SLM with criteria is as valuable as knowing how to deploy it.

    The ecosystem of small language models has grown enormously. Hugging Face has surpassed 2 million public models. Choosing an SLM poorly means wasted time, oversized infrastructure or mediocre results. Choosing an SLM well can make the difference between a viable project and one that never reaches production.

    When does it make sense to use an SLM instead of an LLM?

    Before getting into selection criteria, it is worth being clear about when a small model is the right answer. Choosing an SLM is the correct decision when one or more of these conditions are met:

    • Data privacy: you need data not to leave your infrastructure.
    • Critical latency: your application requires real-time or near-real-time responses.
    • Limited budget: calls to large model APIs are too costly at scale.
    • Bounded task: the model only needs to do one thing well, not everything.
    • Edge deployment: the model will run on a device with limited resources.

    On the other hand, if your case requires complex reasoning, open creative generation or handling multiple domains simultaneously, an LLM remains the most robust option. In that case, choosing an SLM might not be sufficient.

    What technical criteria should you use to choose an SLM?

    Making this decision rigorously requires evaluating at least five technical dimensions before downloading any model. Each criterion directly influences whether the SLM choice will be correct or not.

    Number of parameters and hardware requirements

    The size of the model —measured in billions of parameters (B)— directly determines how much memory you need. For hardware with 8 GB of VRAM, Phi-4-mini (3.8 B) is the best compact reasoner with approximately 3 GB of VRAM in Q4 quantization, and Gemma 3 4B is the best option if you need multimodal capabilities or support for more than 140 languages. This data is essential for choosing an SLM that fits your real infrastructure.

    As a general rule: models of 1-4 B parameters work on laptops with 8 GB of RAM; models of 7-14 B require a dedicated GPU or at least 16 GB of unified RAM. Do not choose the largest model that can run on your hardware; choose the smallest one that solves your task with sufficient quality. This principle is fundamental when choosing an SLM for any production environment.

    Latency and inference

    Latency —the time it takes the model to generate a response— depends on the model size, the hardware and the level of quantization applied. Quantization converts high-precision data to lower precision, which lightens the computational load and speeds up inference. Evaluating real latency on your hardware is an essential step before committing to a model in production. Ignoring this point is one of the most common mistakes when choosing an SLM.

    For interactive applications, aim for models that generate at least 20-30 tokens per second on your hardware. Tools like Ollama show you this metric directly during inference, making it easy to compare candidates when you need to choose an SLM with strict speed requirements.

    Accuracy on the specific task

    General benchmarks are indicative, but real accuracy is what you get on your specific task. A model with a high MMLU score may perform worse than a smaller one in, for example, entity extraction from legal documents in Spanish. This nuance is critical for choosing an SLM objectively.

    The practical recommendation: define a set of 20-50 representative examples of your use case and evaluate each candidate model on them before making the final decision. This is more valuable than any benchmark table and is the most reliable method for choosing an SLM with guarantees.

    License and commercial use

    Not all small language models are free for commercial use. Before integrating an SLM into a product, verify its license. This step is essential when choosing an SLM for a business environment. Qwen 3 SLM models are available under the Apache 2.0 license, and are free to download, fine-tune and use commercially. Other models, such as those in the Gemma family, have their own licenses that allow commercial use under certain conditions.

    Always review the license before building on a model. A subsequent license change can force you to migrate your entire implementation. Taking this into account from the start greatly simplifies choosing an SLM with legal guarantees.

    Multilingual support and real quality in Spanish

    If your project operates in Spanish or other languages other than English, multilingual support is a critical criterion when choosing an SLM. Some models like Qwen 3 support more than 100 languages and dialects. Models trained primarily in English can notably degrade their quality in Spanish.

    To illustrate the difference, consider this information extraction prompt in Spanish: “Extract the customer name, amount and due date from this invoice: ‘Customer: Distribuciones López S.L. Amount: 3,450.00 € Due date: 15/02/2026.’”

    With Qwen 3 4B, the output is structured and precise. With a model without real multilingual support, the typical response mixes languages, omits the currency symbol or reformats the date to the Anglo-Saxon standard. Always test with examples in the production language: public benchmarks are usually measured in English and do not reflect real quality in Spanish. This step is especially relevant when choosing an SLM for Spanish-speaking projects.

    What small language models are available today?

    Visual comparison of available small language models with parameters, memory consumption and inference speed
    Popular models range from 3 billion parameters (very fast, less accurate) to 14 billion (more accurate, higher latency), allowing you to choose according to your balance of resources and quality.

    The ecosystem of small language models has matured rapidly. Knowing the available catalog is indispensable for choosing an SLM in an informed way. These are the most relevant ones in 2025-2026:

    Comparison of popular SLMs for local deployment
    Model Parameters Strength License
    Phi-4-mini 3.8 B Compact reasoning, low consumption MIT
    Gemma 3 4B 4 B Multimodal, 140+ languages Gemma (commercial allowed)
    Llama 3.2 3B 3 B Performance/size balance Llama 3 Community
    Qwen 3 4B 4 B Multilingual, coding, reasoning Apache 2.0
    Mistral 7B 7 B Instructions, general use Apache 2.0

    Phi-4 (14 B) is the reference SLM in general benchmarks —84.8% on MMLU, surpassing GPT-4o in mathematics— and fits in a 12 GB GPU. However, for projects with more limited hardware, 3-4 B models are the most pragmatic starting point for choosing an SLM without oversizing the infrastructure.

    What SLM tools exist for local deployment?

    The tools for local SLM deployment have matured to the point where any developer can have a model running in minutes. Choosing an SLM correctly also involves choosing the right deployment tool.

    Ollama: the standard for local deployment

    Ollama has become the de facto standard for local language model management due to its simplicity: it manages model weights, environment configuration and the API server in a single package. It is one of the first tools you should consider when choosing an SLM for development environments.

    Its most practical advantage is automatic integration: Ollama automatically creates a local server at localhost:11434, which allows integrating the model into Python or JavaScript applications with ease. Furthermore, Ollama allows running models without an internet connection, which helps protect sensitive data. You can consult the official Ollama documentation to see the supported models.

    LM Studio: visual interface for comparing models

    LM Studio provides a graphical interface for users who want to compare different models from Hugging Face; it allows viewing resource usage (CPU/RAM) in real time and selecting specific quantization levels. It is especially useful in the evaluation phase, when you are still trying to choose an SLM among several candidates.

    LM Studio became free for commercial use in July 2025. If you are new to the small model ecosystem, LM Studio is the most user-friendly entry point for choosing an SLM without prior experience.

    llama.cpp and Hugging Face Transformers

    For developers who need greater control, llama.cpp is especially efficient for running quantized models natively. Ollama runs llama.cpp internally, so using it directly gives you access to more configuration options in exchange for greater complexity. This option is suitable when you need to choose an SLM and fine-tune the inference parameters to the maximum.

    Hugging Face Transformers offers a wider range of models and tasks. It is the natural option if you already work with the Python machine learning ecosystem and want to integrate an SLM into an existing data pipeline. Choosing an SLM through Transformers gives access to the largest available model repository.

    RAG with SLM: connect the model to your documents without retraining it

    RAG (Retrieval-Augmented Generation) is the most common architectural pattern for extending the capabilities of an SLM without modifying its weights. The central idea is simple: instead of retraining the model with your data, you provide relevant context in each query, retrieved in real time from your own knowledge base. Choosing an SLM compatible with this pattern greatly expands its usefulness.

    The basic flow of a RAG architecture with a local SLM has three steps:

    1. Indexing: your documents are divided into fragments and converted into numerical vectors using an embeddings model. These vectors are stored in a vector database such as ChromaDB or Qdrant.
    2. Retrieval: when the user asks a question, the system converts the question into a vector and searches for the most similar fragments in the database.
    3. Generation: the SLM receives the original question together with the retrieved fragments and generates a response grounded in that specific information.

    To implement this pattern with a local model, the two most widely used frameworks are LlamaIndex and LangChain. LangChain excels at orchestrating multi-step AI workflows, while LlamaIndex focuses on optimizing document indexing and retrieval. Both make it easier to choose an SLM and connect it to your internal data sources.

    When to use RAG instead of fine-tuning? RAG is the right option when your data changes frequently or when you need the model to cite specific sources. Fine-tuning is more appropriate when you want to modify the model’s response style or specialize its behavior in a static domain. This distinction also influences how to choose the base SLM for each case.

    When to use RAG, fine-tuning or base model? Decision table

    Decision matrix: base model vs. RAG vs. fine-tuning
    Situation Recommendation Reason
    The task is well covered by the pre-trained model Base model Lower complexity, zero adaptation cost
    You need answers about your own documents or changing data RAG No retraining; updatable in real time
    You need brand tone, proprietary categories or very specific behavior Fine-tuning The model internalizes the style and patterns of the domain
    Static domain + specific tone + own data Fine-tuning + RAG Optimal combination for maximum performance in a closed domain

    This table is a quick guide for choosing an SLM with the correct adaptation strategy according to your specific situation.

    SLM fine-tuning: when and how to adjust the model to your domain

    Fine-tuning consists of continuing the training of a pre-trained SLM with your own domain data, so that the model internalizes the vocabulary, style and specific patterns of your use case. It is the right option when RAG is not enough: for example, when you need the model to adopt a very specific brand tone or classify according to proprietary categories. Before applying it, it is important to choose a base SLM that is compatible with the adjustment techniques you plan to use.

    LoRA and QLoRA: efficient fine-tuning on modest hardware

    Full retraining of an SLM requires prohibitive computing resources. Low-rank adaptation techniques (LoRA and QLoRA) solve this problem: instead of updating all the model’s parameters, only additional low-rank matrices are trained that are added to the original, frozen weights. The original LoRA paper (Hu et al., 2021) demonstrated that this technique can match the performance of full fine-tuning with up to 10,000× fewer trainable parameters. This makes choosing an SLM for fine-tuning with LoRA accessible even with modest hardware.

    QLoRA takes this a step further by combining 4-bit quantization with LoRA. With QLoRA it is possible to fine-tune 3B parameter models using only 8 GB of VRAM. Choosing an SLM compatible with QLoRA significantly expands the fine-tuning options on consumer hardware.

    Fine-tuning tools: Unsloth and Axolotl

    Two tools stand out today as the most accessible for fine-tuning SLMs on consumer hardware:

    • Unsloth: uses custom CUDA/Triton kernels that accelerate fine-tuning with LoRA and QLoRA up to 5× while reducing memory usage. It is the fastest option for a single GPU. However, it does not support multi-GPU training.
    • Axolotl: community-oriented for LLM fine-tuning, with YAML-based configurations and extensive integration with Hugging Face libraries. It is the natural option for multi-GPU environments.

    The minimum process for fine-tuning with Unsloth is: prepare a dataset in JSONL format with instruction-response pairs, configure the LoRA parameters, launch the training and export the resulting adapter. With 500-2000 quality examples, an SLM of 3-4 B can specialize notably in a specific task. Choosing an SLM of the right size is the first step before starting any fine-tuning process.

    How to implement an SLM in your project step by step?

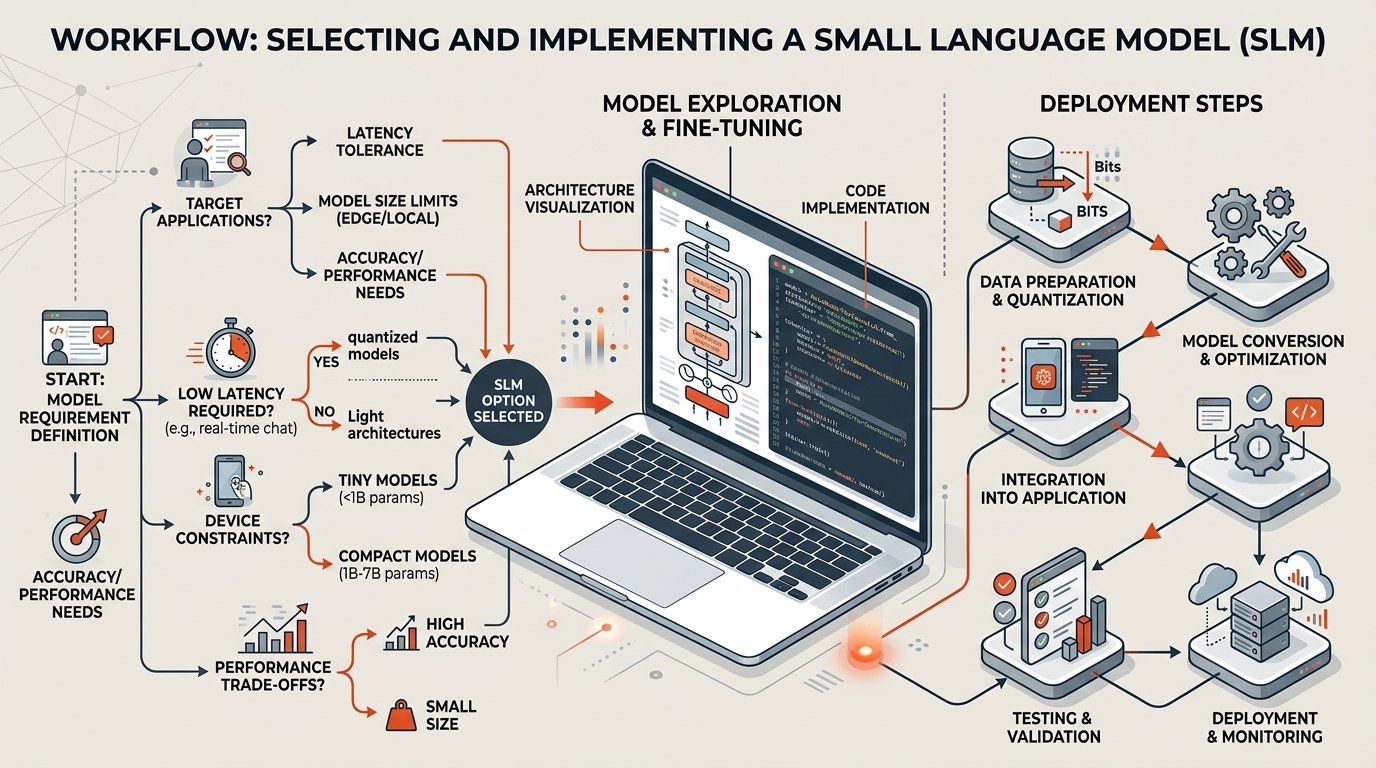
    Implementing an SLM in a real project always follows the same process, regardless of the model or tool you choose. These steps also serve as a guide for choosing an SLM with methodological rigor.

    1. Define the task precisely. Write in one sentence what the SLM must do: “classify support tickets into 5 categories”, “summarize contracts in less than 100 words”. The more bounded the task, the easier it will be to choose the right SLM and implement it.
    2. Evaluate your available hardware. Check the available RAM, whether you have a dedicated GPU and how much VRAM it has. This will determine the range of model sizes you can run and will significantly narrow down how to choose a viable SLM.
    3. Select 2-3 candidate models. Using the criteria described above, choose a small set of candidates. For projects in Spanish, Qwen 3 4B, Gemma 3 4B and Llama 3.2 3B are a good starting point for choosing an SLM with multilingual support.
    4. Install Ollama and download the candidate models. Once installed, download the models with commands like ollama pull qwen3:4b. It is the fastest method for choosing an SLM and testing it locally.
    5. Evaluate with real data. Prepare a set of 20-50 examples of your use case and run each candidate model. Measure accuracy, latency and subjective quality. This evaluation is the objective basis for choosing the definitive SLM.
    6. Apply quantization if necessary. If the chosen model is too slow, try a quantized version (Q4 or Q8). Quantization allows choosing larger SLMs without exceeding your hardware limits.
    7. Integrate via local API. Once the choice is confirmed, integrate it into your application through the local endpoint that Ollama exposes:

    Option A — official Ollama library for Python:

    # pip install ollama
    import ollama

    response = ollama.chat(
    model=”qwen3:4b”,
    messages=[
    {
    “role”: “user”,
    “content”: “Classify this ticket into one of these categories: Billing, Technical support, Shipping, Other. Ticket: ‘My order 12345 has not arrived.’”
    }
    ]
    )

    print(response[“message”][“content”])

    Option B — direct HTTP call with requests:

    import requests, json

    payload = {
    “model”: “qwen3:4b”,
    “messages”: [
    {
    “role”: “user”,
    “content”: “Classify this ticket into one of these categories: Billing, Technical support, Shipping, Other. Ticket: ‘My order 12345 has not arrived.’”
    }
    ],
    “stream”: False
    }

    resp = requests.post(“http://localhost:11434/api/chat”, json=payload)
    data = resp.json()
    print(data[“message”][“content”])

    1. Consider RAG or fine-tuning if base performance is not sufficient. If the model responds well in general but does not know your own data, implement a RAG pipeline. If you need to change the behavior or style of the model, consider fine-tuning with LoRA/QLoRA. In both cases, choosing a base SLM compatible with these techniques greatly facilitates integration.
    2. Monitor and adjust. In production, systematic tracking is what separates a prototype from a reliable system. Choosing an SLM with good documentation and an active community facilitates problem resolution in this phase.

    SLM monitoring in production: tools and metrics

    The monitoring step is the most undervalued of the entire implementation. Without observability, you cannot know when the model fails, why it fails or how to improve it. Choosing an appropriate SLM for production includes considering from the outset how you are going to monitor it.

    Traceability tools for LLM

    Two tools stand out as the standard for observability of language model-based systems:

    • Langfuse: open-source traceability platform for LLMs that records each model call with its prompt, response, latency and estimated cost. It integrates with LangChain, LlamaIndex and direct API calls. It is the most recommended option for small teams that need quick visibility without complex infrastructure. It is especially useful when you have had to choose an SLM without prior experience in observability.
    • Phoenix (Arize): open-source tool focused on evaluation and debugging of RAG and LLM pipelines. Especially useful when you have a RAG pipeline and want to understand which fragments are retrieved and how they affect response quality. Choosing an SLM with active community support facilitates its integration with Phoenix.

    Minimum metrics to record

    Regardless of the tool you use, these are the metrics you should record from the first day in production:

    • p50 and p95 latency: the median tells you typical performance; the 95th percentile tells you how long slow calls take. A p95 above 5 seconds is usually unacceptable in interactive applications. If you detect this problem, it may be a sign that you should choose a lighter SLM or apply more quantization.
    • Error rate: percentage of calls that return an error or an empty response. A rate above 1% in production requires immediate investigation.
    • Response length: responses that are systematically shorter or longer than expected indicate problems with the prompt or the configured temperature.
    • Rejection or hallucination rate: in extraction or classification tasks, measure how many responses do not follow the expected format. A sustained increase may indicate that it is worth choosing an SLM with a better fit to your task.

    Minimum viable log without external tools

    If you cannot integrate Langfuse or Phoenix immediately, this is the minimum log you should implement in Python to have basic visibility:

    import time, json, logging

    logging.basicConfig(filename=”slm_production.log”, level=logging.INFO)

    def call_model_with_log(prompt: str, model: str = “qwen3:4b”) -> str:
    import requests
    start = time.time()
    try:
    resp = requests.post(
    “http://localhost:11434/api/chat”,
    json={“model”: model, “messages”: [{“role”: “user”, “content”: prompt}], “stream”: False},
    timeout=30
    )
    latency_ms = (time.time() – start) * 1000
    output = resp.json()[“message”][“content”]
    logging.info(json.dumps({
    “model”: model,
    “latency_ms”: round(latency_ms, 1),
    “prompt_len”: len(prompt),
    “response_len”: len(output),
    “status”: “ok”
    }))
    return output
    except Exception as e:
    latency_ms = (time.time() – start) * 1000
    logging.error(json.dumps({“model”: model, “latency_ms”: round(latency_ms, 1), “status”: “error”, “error”: str(e)}))
    raise

    This log in JSONL format is directly importable into any analysis tool and allows you to detect performance degradations without depending on external platforms. It is valid regardless of the SLM you have chosen.

    What are the most common mistakes when choosing and implementing an SLM?

    Common mistakes in SLM selection: excessive sizing, ignoring latency, inadequate infrastructure, insufficient testing
    Choosing a model that is too large for your available hardware is the most costly mistake; many developers underestimate the importance of validating latency before moving to production.

    Knowing the common mistakes saves you weeks of work. These are the most frequent ones when working with small language models for the first time and trying to choose an SLM without a clear methodology.

    Choosing by popularity instead of by fit to the task

    The most downloaded model is not necessarily the best for your case. Always evaluate on your own data before committing. Selecting by popularity without empirical validation is one of the most frequent and most avoidable mistakes when choosing an SLM. Popularity is an indicator of community, not of suitability for your specific task.

    Ignoring the limitations of SLMs

    Limited processing capacity can lead to reduced accuracy in tasks involving multi-factor reasoning or high levels of abstraction; therefore, they may not be the best option for applications that require high accuracy, such as scientific research or medical diagnosis. Knowing these limitations is an essential part of knowing how to choose an SLM correctly.

    Skipping the evaluation phase

    Many teams install the first model they find and integrate it directly into production. The evaluation phase with real data is the most profitable investment in the process: it detects problems before they reach users and allows choosing an SLM objectively among the available options.

    Not considering multilingual support from the start

    If your project operates in Spanish, verifying multilingual support from the beginning is critical. Some models notably degrade their quality in Spanish. Always test with examples in the production language, not in English. Overlooking this point when choosing an SLM can ruin the end-user experience even with a technically solid model in English.

    How does local AI deployment fit into a business strategy?

    Local AI deployment with small models is not just a technical decision: it is also a strategic decision. Choosing your own SLM allows SMEs and entrepreneurs to have AI capabilities without depending on external providers, without variable per-call costs and without handing over customer data to third parties.

    To illustrate the economic argument, this indicative estimate compares the cost of an external API versus own infrastructure for a volume of 1 million inferences per month:

    Cost estimate: external API vs. local SLM (1M inferences/month, ~500 token prompts)
    Scenario Estimated cost/month Privacy Latency
    GPT-4o mini API ~€150-300 Data at external provider Variable (network)
    Local SLM (Qwen 3 4B, own server) ~€20-40 (electricity + amortization) Data in your infrastructure Low and predictable
    SLM on cloud VPS (shared GPU) ~€60-100 Data on your VPS Medium-low

    The key point is not the exact number, but the cost structure: with external APIs you pay per inference; with your own SLM, the cost is fixed and scales without marginal cost. Beyond a certain volume, the local model is more economical and more secure. Choosing a local SLM over an external API is, at that scale, as important a business decision as a technical one.

    The most immediate use cases for marketing and business teams include: automatic lead classification, sentiment analysis in reviews, generation of internal content drafts, or customer service assistants that run entirely on your own infrastructure. The key is to start with a bounded task, measure it and scale only when the value is proven. Choosing the right SLM for that first use case is the starting point of any sustainable local AI strategy.

    Frequently asked questions

    How much RAM do I need to run an SLM locally?

    It depends on the model size. For 3-4 B parameter models with Q4 quantization, 8 GB of RAM is sufficient on a modern laptop without a dedicated GPU. For 7 B models, it is recommended to have at least 16 GB of RAM or a GPU with 8 GB of VRAM. Tools like LM Studio show you consumption in real time before confirming the choice, which greatly facilitates knowing how to choose an SLM that fits your hardware.

    What is the difference between Ollama and LM Studio for implementing an SLM?

    Ollama is developer-oriented: it manages models from the command line and exposes a local API that you can consume from any application. LM Studio offers a more visual graphical interface, ideal for comparing models and exploring options without writing code. For production, Ollama is the most common option; for evaluation and experimentation, LM Studio is more comfortable. Both tools are complementary and useful in different phases of the implementation process. Choosing an SLM with one or the other depends on the stage of the project and the team’s profile.

    Can I use an SLM in Spanish with good quality?

    Yes, but you must choose a model with real multilingual support; this is one of the most important considerations when choosing an SLM for projects in Spanish. Qwen 3 and Gemma 3 are the most solid options for Spanish in the small model range. Always verify performance with examples in Spanish before deciding, as benchmarks are usually measured in English and do not necessarily reflect quality in other languages.

    How do I monitor an SLM in production without complex tools?

    The most accessible starting point is a structured log in JSONL format that records latency, prompt and response length, and the status of each call. With that log you can detect performance degradations in any analysis tool. When volume grows, Langfuse (open-source) is the most recommended option for complete LLM traceability without complex infrastructure; Phoenix (Arize) is the best alternative if you have a RAG pipeline and need to evaluate retrieval quality. Choosing an SLM with an active community also makes it easier to find solutions to monitoring problems.

    When does it make sense to fine-tune instead of using RAG?

    RAG is the first option when your data changes frequently or you need the model to cite specific sources: it requires no retraining and is updatable in real time. Fine-tuning is the right option when you need to modify the base behavior of the model: adopting a specific brand tone, classifying according to proprietary categories or generating code in an internal framework. Both patterns are complementary: combining them is the route to the best performance in closed domains. The decision about which to use also influences how to choose the most suitable base SLM for each approach.

    Sources

  • Cómo elegir SLM e implementarlo en tu proyecto paso a paso

    Cómo elegir SLM e implementarlo en tu proyecto paso a paso

    Elegir un SLM —un modelo de lenguaje pequeño (Small Language Model)— es una de las decisiones técnicas más relevantes que puedes tomar cuando quieres integrar IA en un proyecto sin depender de APIs externas ni incurrir en costes desorbitados. Saber cómo elegir SLM correctamente implica evaluar criterios técnicos concretos, conocer las herramientas disponibles y seguir un proceso de implementación ordenado. Esta guía te lleva desde la decisión hasta el despliegue, incluyendo patrones avanzados como RAG y fine-tuning.

    ¿Qué es un SLM y por qué importa elegirlo bien?

    Un SLM es un modelo de inteligencia artificial capaz de procesar y generar lenguaje natural con muchos menos recursos que un LLM convencional. Los pequeños modelos de lenguaje realizan tareas específicas con menos recursos, lo que los convierte en la opción natural para proyectos con restricciones de hardware, privacidad o presupuesto. Elegir SLM adecuadamente marca directamente la viabilidad del proyecto.

    A diferencia de los LLM generalistas, los SLM suelen diseñarse pensando en casos de uso concretos, lo que permite priorizar eficiencia, rapidez y control. En tareas bien delimitadas —clasificación de texto, extracción de datos, asistentes internos, moderación de contenido—, un modelo bien elegido puede superar en rendimiento práctico a uno grande mal ajustado. Por eso, saber elegir SLM con criterio es tan valioso como saber desplegarlo.

    El ecosistema de modelos de lenguaje pequeños ha crecido enormemente. Hugging Face ha superado los 2 millones de modelos públicos. Elegir SLM mal supone tiempo perdido, infraestructura sobredimensionada o resultados mediocres. Elegir SLM bien puede marcar la diferencia entre un proyecto viable y uno que nunca llega a producción.

    ¿Cuándo tiene sentido usar un SLM frente a un LLM?

    Antes de entrar en criterios de selección, conviene tener claro cuándo un modelo pequeño es la respuesta correcta. Elegir SLM es la decisión correcta cuando se cumplen una o varias de estas condiciones:

    • Privacidad de los datos: necesitas que los datos no salgan de tu infraestructura.
    • Latencia crítica: tu aplicación requiere respuestas en tiempo real o casi real.
    • Presupuesto limitado: las llamadas a APIs de modelos grandes son demasiado costosas a escala.
    • Tarea acotada: el modelo solo necesita hacer una cosa bien, no todo.
    • Despliegue en edge: el modelo correrá en un dispositivo con recursos limitados.

    Por el contrario, si tu caso requiere razonamiento complejo, generación creativa abierta o manejo de múltiples dominios simultáneamente, un LLM sigue siendo la opción más robusta. En ese caso, elegir SLM podría no ser suficiente.

    ¿Qué criterios técnicos usar para elegir SLM?

    Tomar esta decisión con rigor requiere evaluar al menos cinco dimensiones técnicas antes de descargar ningún modelo. Cada criterio influye directamente en si la elección del SLM será acertada o no.

    Número de parámetros y requisitos de hardware

    El tamaño del modelo —medido en miles de millones de parámetros (B)— determina directamente cuánta memoria necesitas. Para hardware de 8 GB de VRAM, Phi-4-mini (3,8 B) es el mejor razonador compacto con aproximadamente 3 GB de VRAM en cuantización Q4, y Gemma 3 4B es la mejor opción si necesitas capacidades multimodales o soporte de más de 140 idiomas. Estos datos son esenciales para elegir SLM que encaje con tu infraestructura real.

    Como regla general: modelos de 1-4 B parámetros funcionan en portátiles con 8 GB de RAM; modelos de 7-14 B requieren una GPU dedicada o al menos 16 GB de RAM unificada. No elijas el modelo más grande que pueda correr en tu hardware; elige el más pequeño que resuelva tu tarea con calidad suficiente. Este principio es fundamental al elegir SLM para cualquier entorno de producción.

    Latencia e inferencia

    La latencia —el tiempo que tarda el modelo en generar una respuesta— depende del tamaño del modelo, del hardware y del nivel de cuantización aplicado. La cuantización convierte datos de alta precisión a menor precisión, lo que aligera la carga computacional y acelera la inferencia. Evaluar la latencia real en tu hardware es un paso imprescindible antes de comprometerte con un modelo en producción. Ignorar este punto es uno de los errores más comunes al elegir SLM.

    Para aplicaciones interactivas, apunta a modelos que generen al menos 20-30 tokens por segundo en tu hardware. Herramientas como Ollama te muestran esta métrica directamente durante la inferencia, lo que facilita comparar candidatos cuando necesitas elegir SLM con requisitos de velocidad estrictos.

    Precisión en la tarea específica

    Los benchmarks generales son orientativos, pero la precisión real es la que obtienes en tu tarea concreta. Un modelo con un MMLU alto puede comportarse peor que uno más pequeño en, por ejemplo, extracción de entidades en documentos legales en español. Este matiz es crítico para elegir SLM de forma objetiva.

    La recomendación práctica: define un conjunto de 20-50 ejemplos representativos de tu caso de uso y evalúa cada modelo candidato sobre ellos antes de tomar la decisión final. Esto es más valioso que cualquier tabla de benchmarks y es el método más fiable para elegir SLM con garantías.

    Licencia y uso comercial

    No todos los modelos de lenguaje pequeños son libres para uso comercial. Antes de integrar un SLM en un producto, verifica su licencia. Este paso es imprescindible al elegir SLM para un entorno empresarial. Los modelos Qwen 3 SLM están disponibles bajo la licencia Apache 2.0, y son de descarga gratuita, ajuste fino y uso comercial. Otros modelos, como los de la familia Gemma, tienen licencias propias que permiten el uso comercial con ciertas condiciones.

    Revisa siempre la licencia antes de construir sobre un modelo. Un cambio de licencia a posteriori puede obligarte a migrar toda tu implementación. Tenerlo en cuenta desde el principio simplifica mucho elegir SLM con garantías legales.

    Soporte multilingüe y calidad real en español

    Si tu proyecto opera en español u otros idiomas distintos del inglés, el soporte multilingüe es un criterio crítico al elegir SLM. Algunos modelos como Qwen 3 soportan más de 100 idiomas y dialectos. Modelos entrenados principalmente en inglés pueden degradar notablemente su calidad en castellano.

    Para ilustrar la diferencia, considera este prompt de extracción de información en castellano: “Extrae el nombre del cliente, el importe y la fecha de vencimiento de esta factura: ‘Cliente: Distribuciones López S.L. Importe: 3.450,00 € Vencimiento: 15/02/2026.’”

    Con Qwen 3 4B, la salida es estructurada y precisa. Con un modelo sin soporte multilingüe real, la respuesta típica mezcla idiomas, omite el símbolo de moneda o reformatea la fecha al estándar anglosajón. Prueba siempre con ejemplos en el idioma de producción: los benchmarks públicos suelen medirse en inglés y no reflejan la calidad real en castellano. Este paso es especialmente relevante para elegir SLM en proyectos hispanohablantes.

    ¿Qué modelos de lenguaje pequeños están disponibles hoy?

    Comparativa visual de modelos de lenguaje pequeños disponibles con parámetros, consumo de memoria y velocidad de inferencia
    Los modelos populares varían desde 3 mil millones de parámetros (muy rápidos, menos precisos) hasta 14 mil millones (más precisos, mayor latencia), permitiéndote elegir según tu balance de recursos y calidad.

    El ecosistema de modelos de lenguaje pequeños ha madurado rápidamente. Conocer el catálogo disponible es indispensable para elegir SLM de forma informada. Estos son los más relevantes en 2025-2026:

    Comparativa de SLMs populares para despliegue local
    Modelo Parámetros Punto fuerte Licencia
    Phi-4-mini 3,8 B Razonamiento compacto, bajo consumo MIT
    Gemma 3 4B 4 B Multimodal, 140+ idiomas Gemma (comercial permitido)
    Llama 3.2 3B 3 B Equilibrio rendimiento/tamaño Llama 3 Community
    Qwen 3 4B 4 B Multilingüe, coding, razonamiento Apache 2.0
    Mistral 7B 7 B Instrucciones, uso general Apache 2.0

    Phi-4 (14 B) es el SLM de referencia en benchmarks generales —84,8 % en MMLU, superando a GPT-4o en matemáticas— y cabe en una GPU de 12 GB. Sin embargo, para proyectos con hardware más limitado, los modelos de 3-4 B son el punto de partida más pragmático para elegir SLM sin sobredimensionar la infraestructura.

    ¿Qué herramientas SLM existen para el despliegue local?

    Las herramientas para despliegue local de SLM han madurado hasta el punto de que cualquier desarrollador puede tener un modelo corriendo en minutos. Elegir SLM correctamente también implica elegir la herramienta de despliegue adecuada.

    Ollama: el estándar para despliegue local

    Ollama se ha convertido en el estándar de facto para la gestión local de modelos de lenguaje por su simplicidad: gestiona los pesos del modelo, la configuración del entorno y el servidor de API en un único paquete. Es una de las primeras herramientas que debes valorar al elegir SLM para entornos de desarrollo.

    Su ventaja más práctica es la integración automática: Ollama crea automáticamente un servidor local en localhost:11434, lo que permite integrar el modelo en aplicaciones Python o JavaScript con facilidad. Además, Ollama permite ejecutar modelos sin conexión a internet, lo que ayuda a proteger datos sensibles. Puedes consultar la documentación oficial de Ollama para ver los modelos soportados.

    LM Studio: interfaz visual para comparar modelos

    LM Studio proporciona una interfaz gráfica para usuarios que quieren comparar distintos modelos de Hugging Face; permite ver el uso de recursos (CPU/RAM) en tiempo real y seleccionar niveles específicos de cuantización. Es especialmente útil en la fase de evaluación, cuando todavía estás intentando elegir SLM entre varios candidatos.

    LM Studio pasó a ser gratuito para uso comercial en julio de 2025. Si eres nuevo en el ecosistema de modelos pequeños, LM Studio es el punto de entrada más amigable para elegir SLM sin experiencia previa.

    llama.cpp y Hugging Face Transformers

    Para desarrolladores que necesitan mayor control, llama.cpp es especialmente eficiente para ejecutar modelos cuantizados de forma nativa. Ollama ejecuta llama.cpp internamente, por lo que usarlo directamente te da acceso a más opciones de configuración a cambio de mayor complejidad. Esta opción es adecuada cuando necesitas elegir SLM y ajustar al máximo los parámetros de inferencia.

    Hugging Face Transformers ofrece una gama más amplia de modelos y tareas. Es la opción natural si ya trabajas con el ecosistema Python de machine learning y quieres integrar un SLM en un pipeline de datos existente. Elegir SLM a través de Transformers da acceso al mayor repositorio de modelos disponible.

    RAG con SLM: conecta el modelo a tus documentos sin reentrenarlo

    RAG (Retrieval-Augmented Generation) es el patrón arquitectónico más habitual para extender las capacidades de un SLM sin modificar sus pesos. La idea central es sencilla: en lugar de reentrenar el modelo con tus datos, le proporcionas contexto relevante en cada consulta, recuperado en tiempo real desde una base de conocimiento propia. Elegir SLM compatible con este patrón amplía enormemente su utilidad.

    El flujo básico de una arquitectura RAG con un SLM local tiene tres pasos:

    1. Indexación: tus documentos se dividen en fragmentos y se convierten en vectores numéricos mediante un modelo de embeddings. Estos vectores se almacenan en una base de datos vectorial como ChromaDB o Qdrant.
    2. Recuperación: cuando el usuario hace una pregunta, el sistema convierte la pregunta en un vector y busca los fragmentos más similares en la base de datos.
    3. Generación: el SLM recibe la pregunta original junto con los fragmentos recuperados y genera una respuesta fundamentada en esa información concreta.

    Para implementar este patrón con un modelo local, los dos frameworks más utilizados son LlamaIndex y LangChain. LangChain excela en la orquestación de flujos de trabajo de IA en varios pasos, mientras que LlamaIndex se centra en optimizar la indexación y recuperación de documentos. Ambos facilitan elegir SLM y conectarlo a tus fuentes de datos internas.

    ¿Cuándo usar RAG en lugar de fine-tuning? RAG es la opción correcta cuando tus datos cambian con frecuencia o cuando necesitas que el modelo cite fuentes concretas. El fine-tuning es más adecuado cuando quieres modificar el estilo de respuesta del modelo o especializar su comportamiento en un dominio estático. Esta distinción también influye en cómo elegir SLM base para cada caso.

    ¿Cuándo usar RAG, fine-tuning o modelo base? Tabla de decisión

    Matriz de decisión: modelo base vs. RAG vs. fine-tuning
    Situación Recomendación Motivo
    La tarea está bien cubierta por el modelo preentrenado Modelo base Menor complejidad, coste cero de adaptación
    Necesitas respuestas sobre documentos propios o datos que cambian RAG Sin reentrenamiento; actualizable en tiempo real
    Necesitas tono de marca, categorías propietarias o comportamiento muy específico Fine-tuning El modelo interioriza el estilo y los patrones del dominio
    Dominio estático + tono específico + datos propios Fine-tuning + RAG Combinación óptima para máximo rendimiento en dominio cerrado

    Esta tabla es una guía rápida para elegir SLM con la estrategia de adaptación correcta según tu situación concreta.

    Fine-tuning de SLM: cuándo y cómo ajustar el modelo a tu dominio

    El fine-tuning consiste en continuar el entrenamiento de un SLM preentrenado con datos propios de tu dominio, de modo que el modelo interioriza el vocabulario, el estilo y los patrones específicos de tu caso de uso. Es la opción correcta cuando RAG no es suficiente: por ejemplo, cuando necesitas que el modelo adopte un tono de marca muy específico o clasifique según categorías propietarias. Antes de aplicarlo, es importante elegir SLM base que sea compatible con las técnicas de ajuste que planeas usar.

    LoRA y QLoRA: fine-tuning eficiente en hardware modesto

    El reentrenamiento completo de un SLM requiere recursos de cómputo prohibitivos. Las técnicas de adaptación de bajo rango (LoRA y QLoRA) resuelven este problema: en lugar de actualizar todos los parámetros del modelo, solo se entrenan matrices adicionales de rango reducido que se añaden a los pesos originales, congelados. El paper original de LoRA (Hu et al., 2021) demostró que esta técnica puede igualar el rendimiento del fine-tuning completo con hasta un 10.000× menos de parámetros entrenables. Esto hace que elegir SLM para fine-tuning con LoRA sea accesible incluso con hardware modesto.

    QLoRA lleva esto un paso más lejos combinando la cuantización de 4 bits con LoRA. Con QLoRA es posible hacer fine-tuning de modelos de 3B parámetros usando solo 8 GB de VRAM. Elegir SLM compatible con QLoRA amplía significativamente las opciones de ajuste fino en equipos de consumo.

    Herramientas para el fine-tuning: Unsloth y Axolotl

    Dos herramientas destacan hoy como las más accesibles para hacer fine-tuning de SLMs en hardware de consumo:

    • Unsloth: utiliza kernels CUDA/Triton personalizados que aceleran el fine-tuning con LoRA y QLoRA hasta 5× mientras reducen el uso de memoria. Es la opción más rápida para un único GPU. Sin embargo, no soporta entrenamiento multi-GPU.
    • Axolotl: orientado a la comunidad para el fine-tuning de LLMs, con configuraciones basadas en YAML e integración extensa con las librerías de Hugging Face. Es la opción natural para entornos multi-GPU.

    El proceso mínimo para hacer fine-tuning con Unsloth es: preparar un dataset en formato JSONL con pares instrucción-respuesta, configurar los parámetros LoRA, lanzar el entrenamiento y exportar el adaptador resultante. Con 500-2000 ejemplos de calidad, un SLM de 3-4 B puede especializarse notablemente en una tarea concreta. Elegir SLM de tamaño adecuado es el primer paso antes de iniciar cualquier proceso de fine-tuning.

    ¿Cómo implementar SLM en tu proyecto paso a paso?

    Implementar un SLM en un proyecto real sigue siempre el mismo proceso, independientemente del modelo o la herramienta que elijas. Estos pasos también sirven como guía para elegir SLM con rigor metodológico.

    1. Define la tarea con precisión. Escribe en una frase qué debe hacer el SLM: «clasificar tickets de soporte en 5 categorías», «resumir contratos en menos de 100 palabras». Cuanto más acotada sea la tarea, más fácil será elegir SLM correcto e implementarlo.
    2. Evalúa tu hardware disponible. Comprueba la RAM disponible, si tienes GPU dedicada y cuánta VRAM tiene. Esto determinará el rango de tamaños de modelo que puedes ejecutar y acotará significativamente cómo elegir SLM viable.
    3. Selecciona 2-3 modelos candidatos. Usando los criterios descritos anteriormente, elige un conjunto pequeño de candidatos. Para proyectos en español, Qwen 3 4B, Gemma 3 4B y Llama 3.2 3B son un buen punto de partida para elegir SLM con soporte multilingüe.
    4. Instala Ollama y descarga los modelos candidatos. Una vez instalado, descarga los modelos con comandos como ollama pull qwen3:4b. Es el método más rápido para elegir SLM y probarlo en local.
    5. Evalúa con datos reales. Prepara un conjunto de 20-50 ejemplos de tu caso de uso y ejecuta cada modelo candidato. Mide precisión, latencia y calidad subjetiva. Esta evaluación es la base objetiva para elegir SLM definitivo.
    6. Aplica cuantización si es necesario. Si el modelo elegido es demasiado lento, prueba una versión cuantizada (Q4 o Q8). La cuantización permite elegir SLM más grandes sin exceder los límites de tu hardware.
    7. Integra vía API local. Una vez confirmada la elección, intégralo en tu aplicación a través del endpoint local que Ollama expone:

    Opción A — librería oficial de Ollama para Python:

    # pip install ollama
    import ollama

    response = ollama.chat(
    model=”qwen3:4b”,
    messages=[
    {
    “role”: “user”,
    “content”: “Clasifica este ticket en una de estas categorías: Facturación, Soporte técnico, Envíos, Otros. Ticket: ‘No me ha llegado el pedido 12345.’”
    }
    ]
    )

    print(response[“message”][“content”])

    Opción B — llamada HTTP directa con requests:

    import requests, json

    payload = {
    “model”: “qwen3:4b”,
    “messages”: [
    {
    “role”: “user”,
    “content”: “Clasifica este ticket en una de estas categorías: Facturación, Soporte técnico, Envíos, Otros. Ticket: ‘No me ha llegado el pedido 12345.’”
    }
    ],
    “stream”: False
    }

    resp = requests.post(“http://localhost:11434/api/chat”, json=payload)
    data = resp.json()
    print(data[“message”][“content”])

    1. Considera RAG o fine-tuning si el rendimiento base no es suficiente. Si el modelo responde bien en general pero no conoce tus datos propios, implementa un pipeline RAG. Si necesitas cambiar el comportamiento o el estilo del modelo, valora el fine-tuning con LoRA/QLoRA. En ambos casos, elegir SLM base compatible con estas técnicas facilita mucho la integración.
    2. Monitoriza y ajusta. En producción, el seguimiento sistemático es lo que separa un prototipo de un sistema fiable. Elegir SLM con buena documentación y comunidad activa facilita la resolución de problemas en esta fase.

    Monitorización de SLM en producción: herramientas y métricas

    El paso de monitorización es el más infravalorado de toda la implementación. Sin observabilidad, no puedes saber cuándo el modelo falla, por qué falla ni cómo mejorarlo. Elegir SLM adecuado para producción incluye considerar desde el principio cómo vas a monitorizarlo.

    Herramientas de trazabilidad para LLM

    Dos herramientas destacan como estándar para la observabilidad de sistemas basados en modelos de lenguaje:

    • Langfuse: plataforma open-source de trazabilidad para LLM que registra cada llamada al modelo con su prompt, respuesta, latencia y coste estimado. Se integra con LangChain, LlamaIndex y llamadas directas a la API. Es la opción más recomendada para equipos pequeños que necesitan visibilidad rápida sin infraestructura compleja. Es especialmente útil cuando has tenido que elegir SLM sin experiencia previa en observabilidad.
    • Phoenix (Arize): herramienta open-source orientada a la evaluación y depuración de pipelines RAG y LLM. Especialmente útil cuando tienes un pipeline RAG y quieres entender qué fragmentos se recuperan y cómo afectan a la calidad de la respuesta. Elegir SLM con soporte activo de la comunidad facilita su integración con Phoenix.

    Métricas mínimas a registrar

    Independientemente de la herramienta que uses, estas son las métricas que debes registrar desde el primer día en producción:

    • Latencia p50 y p95: la mediana te dice el rendimiento típico; el percentil 95 te dice cuánto tardan las llamadas lentas. Un p95 por encima de 5 segundos suele ser inaceptable en aplicaciones interactivas. Si detectas este problema, puede ser señal de que debes elegir SLM más ligero o aplicar más cuantización.
    • Tasa de error: porcentaje de llamadas que devuelven un error o una respuesta vacía. Una tasa superior al 1% en producción requiere investigación inmediata.
    • Longitud de respuesta: respuestas sistemáticamente más cortas o más largas de lo esperado indican problemas con el prompt o con la temperatura configurada.
    • Tasa de rechazo o alucinación: en tareas de extracción o clasificación, mide cuántas respuestas no siguen el formato esperado. Un incremento sostenido puede indicar que conviene elegir SLM con mejor ajuste a tu tarea.

    Log mínimo viable sin herramientas externas

    Si no puedes integrar Langfuse o Phoenix de inmediato, este es el log mínimo que debes implementar en Python para tener visibilidad básica:

    import time, json, logging

    logging.basicConfig(filename=”slm_production.log”, level=logging.INFO)

    def call_model_with_log(prompt: str, model: str = “qwen3:4b”) -> str:
    import requests
    start = time.time()
    try:
    resp = requests.post(
    “http://localhost:11434/api/chat”,
    json={“model”: model, “messages”: [{“role”: “user”, “content”: prompt}], “stream”: False},
    timeout=30
    )
    latency_ms = (time.time() – start) * 1000
    output = resp.json()[“message”][“content”]
    logging.info(json.dumps({
    “model”: model,
    “latency_ms”: round(latency_ms, 1),
    “prompt_len”: len(prompt),
    “response_len”: len(output),
    “status”: “ok”
    }))
    return output
    except Exception as e:
    latency_ms = (time.time() – start) * 1000
    logging.error(json.dumps({“model”: model, “latency_ms”: round(latency_ms, 1), “status”: “error”, “error”: str(e)}))
    raise

    Este log en formato JSONL es directamente importable en cualquier herramienta de análisis y te permite detectar degradaciones de rendimiento sin depender de plataformas externas. Es válido independientemente del SLM que hayas elegido.

    ¿Cuáles son los errores más comunes al elegir e implementar un SLM?

    Errores comunes en la selección de SLM: dimensionamiento excesivo, ignorar latencia, infraestructura inadecuada, testing insuficiente
    Elegir un modelo demasiado grande para tu hardware disponible es el error más costoso; muchos desarrolladores subestiman la importancia de validar latencia antes de pasar a producción.

    Conocer los errores habituales te ahorra semanas de trabajo. Estos son los más frecuentes cuando se trabaja con modelos de lenguaje pequeños por primera vez y se intenta elegir SLM sin una metodología clara.

    Elegir por popularidad en lugar de por ajuste a la tarea

    El modelo más descargado no es necesariamente el mejor para tu caso. Evalúa siempre sobre tus propios datos antes de comprometerte. Seleccionar por popularidad sin validación empírica es uno de los errores más frecuentes y más evitables al elegir SLM. La popularidad es un indicador de comunidad, no de idoneidad para tu tarea específica.

    Ignorar las limitaciones de los SLM

    La capacidad de procesamiento limitada puede dar lugar a una precisión reducida en tareas que implican razonamientos multifactor o altos niveles de abstracción; por lo tanto, es posible que no sean la mejor opción para aplicaciones que requieren una precisión alta, como la investigación científica o el diagnóstico médico. Conocer estas limitaciones es parte esencial de saber elegir SLM correctamente.

    Saltarse la fase de evaluación

    Muchos equipos instalan el primer modelo que encuentran y lo integran directamente en producción. La fase de evaluación con datos reales es la inversión más rentable del proceso: detecta problemas antes de que lleguen a los usuarios y permite elegir SLM de forma objetiva entre las opciones disponibles.

    No considerar el soporte multilingüe desde el inicio

    Si tu proyecto opera en español, verificar el soporte multilingüe desde el principio es crítico. Algunos modelos degradan notablemente su calidad en castellano. Prueba siempre con ejemplos en el idioma de producción, no en inglés. Pasar por alto este punto al elegir SLM puede arruinar la experiencia de usuario final incluso con un modelo técnicamente sólido en inglés.

    ¿Cómo encaja el despliegue local de IA en una estrategia de negocio?

    El despliegue local de IA con modelos pequeños no es solo una decisión técnica: es también una decisión estratégica. Elegir SLM propio permite a pymes y emprendedores tener capacidades de IA sin depender de proveedores externos, sin costes variables por llamada y sin ceder datos de clientes a terceros.

    Para ilustrar el argumento económico, esta estimación orientativa compara el coste de API externa frente a infraestructura propia para un volumen de 1 millón de inferencias al mes:

    Estimación de costes: API externa vs. SLM local (1M inferencias/mes, prompts de ~500 tokens)
    Escenario Coste estimado/mes Privacidad Latencia
    API GPT-4o mini ~150-300 € Datos en proveedor externo Variable (red)
    SLM local (Qwen 3 4B, servidor propio) ~20-40 € (electricidad + amortización) Datos en tu infraestructura Baja y predecible
    SLM en VPS cloud (GPU compartida) ~60-100 € Datos en tu VPS Media-baja

    El punto clave no es el número exacto, sino la estructura del coste: con APIs externas pagas por cada inferencia; con un SLM propio, el coste es fijo y escala sin coste marginal. A partir de cierto volumen, el modelo local es más económico y más seguro. Elegir SLM local frente a API externa es, a esa escala, una decisión de negocio tan importante como técnica.

    Los casos de uso más inmediatos para equipos de marketing y negocio incluyen: clasificación automática de leads, análisis de sentimiento en reseñas, generación de borradores de contenido interno, o asistentes de atención al cliente que corren completamente en la infraestructura propia. La clave es empezar con una tarea acotada, medirla y escalar solo cuando el valor está demostrado. Elegir SLM adecuado para ese primer caso de uso es el punto de partida de cualquier estrategia de IA local sostenible.

    Preguntas frecuentes

    ¿Cuánta RAM necesito para ejecutar un SLM localmente?

    Depende del tamaño del modelo. Para modelos de 3-4 B parámetros con cuantización Q4, son suficientes 8 GB de RAM en un portátil moderno sin GPU dedicada. Para modelos de 7 B, lo recomendable es tener al menos 16 GB de RAM o una GPU con 8 GB de VRAM. Herramientas como LM Studio te muestran el consumo en tiempo real antes de confirmar la elección, lo que facilita enormemente saber cómo elegir SLM que se ajuste a tu hardware.

    ¿Qué diferencia hay entre Ollama y LM Studio para implementar SLM?

    Ollama está orientado a desarrolladores: gestiona modelos desde la línea de comandos y expone una API local que puedes consumir desde cualquier aplicación. LM Studio ofrece una interfaz gráfica más visual, ideal para comparar modelos y explorar opciones sin escribir código. Para producción, Ollama es la opción más habitual; para evaluación y experimentación, LM Studio es más cómodo. Ambas herramientas son complementarias y útiles en diferentes fases del proceso de implementación. Elegir SLM con una u otra depende del momento del proyecto y del perfil del equipo.

    ¿Puedo usar un SLM en español con buena calidad?

    Sí, pero debes elegir un modelo con soporte multilingüe real; esta es una de las consideraciones más importantes al elegir SLM para proyectos en castellano. Qwen 3 y Gemma 3 son las opciones más sólidas para español en la gama de modelos pequeños. Verifica siempre el rendimiento con ejemplos en castellano antes de decidir, ya que los benchmarks suelen medirse en inglés y no reflejan necesariamente la calidad en otros idiomas.

    ¿Cómo monitorizo un SLM en producción sin herramientas complejas?

    El punto de partida más accesible es un log estructurado en formato JSONL que registre latencia, longitud de prompt y respuesta, y estado de cada llamada. Con ese log puedes detectar degradaciones de rendimiento en cualquier herramienta de análisis. Cuando el volumen crezca, Langfuse (open-source) es la opción más recomendada para trazabilidad completa de LLM sin infraestructura compleja; Phoenix (Arize) es la mejor alternativa si tienes un pipeline RAG y necesitas evaluar la calidad de la recuperación. Elegir SLM con comunidad activa también facilita encontrar soluciones a problemas de monitorización.

    ¿Cuándo tiene sentido hacer fine-tuning en lugar de usar RAG?

    RAG es la primera opción cuando tus datos cambian con frecuencia o necesitas que el modelo cite fuentes concretas: no requiere reentrenamiento y es actualizable en tiempo real. El fine-tuning es la opción correcta cuando necesitas modificar el comportamiento base del modelo: adoptar un tono de marca específico, clasificar según categorías propietarias o generar código en un framework interno. Ambos patrones son complementarios: combinarlos es la ruta hacia el mejor rendimiento en dominios cerrados. La decisión sobre cuál usar también influye en cómo elegir SLM base más adecuado para cada enfoque.

    Fuentes

  • Customer Segmentation: Criteria, Methods and Effective Segments

    Customer Segmentation: Criteria, Methods and Effective Segments

    Customer segmentation is one of the pillars of modern marketing. It consists of dividing your customer base into homogeneous groups to address each one with messages, offers and channels tailored to their real needs. Without customer segmentation, any campaign risks being too generic to be effective. According to Salesforce’s State of Marketing report, 84% of customers expect to be treated as a person, not a number; and high-performing marketing teams are 2.4 times more likely to personalize their communications at scale. McKinsey estimates that personalization based on segmentation can reduce acquisition costs by up to 50% and increase revenue by between 5% and 15%.

    What is customer segmentation and why does it matter?

    Segmenting means grouping people with similar characteristics or behaviors within a broader market. The goal of customer segmentation is not to classify for the sake of classifying, but to identify patterns that allow you to personalize your marketing and sales strategy.

    When you know each segment well, you can adjust the message, the channel and the moment of contact. The result is more relevant communication, a higher conversion rate and a better customer experience. Companies that implement effective customer segmentation can reduce acquisition costs by focusing resources on audiences with a higher probability of conversion. In short, segmentation turns data into decisions and opens the door to dynamic personalization.

    What are the main segmentation criteria?

    There are four major blocks of criteria that you can combine according to your business and the available data to carry out effective customer segmentation.

    Demographic criteria

    These are the most commonly used as a starting point in any customer segmentation process. They include variables such as age, gender, income level, educational level or family situation. Demographic criteria are easy to obtain and allow you to build basic profiles quickly.

    For example, a management software brand can segment by company size and decision-maker role, differentiating between the freelancer who needs simplicity and the financial director of an SME who prioritizes integrations.

    Geographic criteria

    Location remains a relevant criterion in customer segmentation, especially for businesses with a local presence or with offers that vary by region. You can segment by country, region, city or even by population density.

    An ecommerce store, for example, can adapt its promotions according to the seasonal climate of each geographic area.

    Psychographic criteria

    This includes the values, lifestyle, interests and personality of the customer. This type of customer segmentation is harder to measure than demographic segmentation, but offers a deeper understanding of purchase motivations and the complete customer journey.

    A healthy food brand, for example, does not address someone who practices competitive sport in the same way as someone who is looking to improve their diet on medical advice.

    Behavioral criteria

    Purchase behavior is one of the most valuable criteria in customer segmentation. It analyzes how customers interact with your brand: purchase frequency, average ticket, preferred channels, response to promotions or the customer lifecycle stage.

    This type of segmentation makes it possible to identify, for example, high-value customers who buy frequently but never open your emails, and to design a specific strategy to reactivate them through another channel. It is also the basis for measuring purchase propensity and detecting potential churn rate.

    B2B vs. B2C segmentation: key differences

    Customer segmentation does not work the same way in all markets. When you sell to businesses (B2B), the criteria and the decision-making process change substantially compared to when you sell to end consumers (B2C).

    B2B segmentation

    In B2B environments, the most relevant criteria for customer segmentation are usually the industry sector, company size, the contact’s role and the stage of the buying process. The sales cycle is longer, several decision-makers are involved and purchase propensity depends on both rational factors and the relationship with the supplier.

    A typical example: segmenting by annual revenue and number of employees to differentiate between SMEs that need a turnkey solution and large accounts that require integration with their existing systems. In B2B, lead scoring is the mechanism that translates customer segmentation into commercial prioritization.

    B2C segmentation

    In B2C environments, behavioral and psychographic criteria carry more weight in customer segmentation. The volume of customers is higher, decisions are faster and microsegmentation allows communication to be refined at a low marginal cost.

    A fashion retailer, for example, can segment by browsing history, categories viewed and purchase frequency to launch hyperpersonalized reactivation campaigns. Lookalike audiences extend this logic: starting from a high-value customer segment, advertising platforms identify new profiles with analogous behaviors.

    Customer lifecycle segmentation

    One of the most powerful applications of customer segmentation is classifying users according to the stage of their relationship with the brand. The customer lifecycle defines what each person needs at each moment, and allows you to design radically different actions for groups that, in demographic terms, would be identical.

    New customer

    They have made their first purchase in the last 30–60 days. The priority objective is to turn that first transaction into a habit: the second purchase is the most predictive indicator of long-term retention, according to Bain & Company studies. The recommended action is an onboarding sequence that educates about the product and facilitates the second conversion with a low-cost incentive.

    Active customer

    They buy regularly within the expected frequency window for your category. The risk here is complacency: assuming they will keep buying without stimulation. The recommended actions are loyalty programs, cross-selling and upselling based on purchase history.

    At-risk customer

    Their purchase frequency has fallen below the segment average or more time than usual has passed since their last transaction. Detecting this stage before the customer leaves is the greatest return of behavioral segmentation: intervening at risk costs between 5 and 25 times less than recovering an already lost customer (Harvard Business Review). The recommended action is a proactive retention campaign.

    Inactive customer

    They have not purchased in a period significantly longer than their historical frequency. In ecommerce, this is usually set at between 6 and 12 months. Not all inactive customers deserve the same recovery effort: prioritize those who had a high LTV before becoming inactive. The recommended action is a win-back campaign with a clear incentive.

    Recovered customer

    They have purchased again after a period of inactivity. This is the most fragile segment: they have a higher probability of becoming inactive again than a customer who never left. The recommended action is to treat them like a new customer: a reactivation sequence and close follow-up in the first 60 days.

    Stage Classification criterion Warning signal Recommended action
    New First purchase in the last 30–60 days No second purchase after 45 days Onboarding sequence + second purchase incentive
    Active Frequency within the expected window Drop in average ticket Cross-sell, upsell, loyalty program
    At risk Frequency below segment average Time without purchase exceeds historical average Proactive retention campaign, NPS survey
    Inactive No purchase in 6–12 months (depending on sector) No email opens in 90 days Win-back with incentive; if no response, suppress
    Recovered Purchase after a period of inactivity Second inactivity in the first 60 days Treatment as a new customer + close follow-up

    What methods exist for creating segments?

    Once the customer segmentation criteria are defined, you need a method to build the segments systematically. The most common are:

    • A priori segmentation: you define the groups before analyzing the data, based on known criteria. It is quick and easy to implement, although it can be imprecise.
    • Cluster-based segmentation: you use statistical or machine learning techniques to let the data reveal natural groupings. It is more complex, but produces segments that are more aligned with reality.
    • RFM segmentation: classifies customers according to Recency, Frequency and Monetary Value. It is especially useful in ecommerce and retail.
    • Predictive segmentation: applies machine learning models to behavioral history to anticipate which customers are most likely to buy, to churn or to respond to a specific offer.
    • Buyer personas: semi-fictional representations of ideal customers, built from real data and interviews. They complement quantitative segmentation with a qualitative dimension and are the natural bridge to content strategy.
    Method Complexity Data required Ideal use case
    A priori Low Basic variables (age, sector, geography) First segmentations or limited resources
    Clusters High Behavioral history and multiple attributes Large databases with non-obvious patterns
    RFM Medium Transaction history Ecommerce, retail and subscriptions
    Predictive High Historical behavior + contextual signals Reduce churn, prioritize leads, dynamic personalization
    Buyer personas Medium Interviews, surveys and qualitative data Content strategy and brand positioning

    Real use case: RFM segmentation in a fashion ecommerce store

    This is a representative case — based on common patterns in customer segmentation projects for fashion ecommerce stores with databases of between 50,000 and 150,000 records — that illustrates the real impact of moving from mass communication to RFM segmentation.

    Starting situation: a fashion ecommerce store with 80,000 active customers was sending the same weekly newsletter to the entire database. The average open rate was 18% and the conversion rate on sends was 1.2%.

    Intervention: an RFM model was applied to classify the database into five operational segments: champions, at-risk loyals, occasional buyers, recent inactives and deep inactives. Each segment received a different communication sequence.

    Results after 90 days:

    • The average open rate rose from 18% to 29% (+61% relative).
    • The conversion rate on sends went from 1.2% to 2.7% (+125% relative).
    • The average LTV of the champions segment grew by 22% in the quarter.
    • The cost per new customer acquisition fell to €27 (–29%).

    The key was not the technology, but the discipline of not sending the same message to everyone. Customer segmentation does not require artificial intelligence to generate results: it requires clear criteria, clean data and the willingness to execute in a differentiated way.

    Tools for implementing customer segmentation

    Segmentation tools dashboard with customer data transformed into visually differentiated groups by color.
    Modern segmentation platforms automate the classification of raw data into cohesive clusters, reducing manual time and improving accuracy in identifying behavioral patterns.

    Knowing the methods is only half the work. The other half is executing customer segmentation with the right tools:

    • HubSpot: ideal for customer segmentation in B2B environments. It allows you to create dynamic lists based on contact properties, website behavior and lifecycle stage.
    • Klaviyo: a reference in ecommerce for RFM segmentation and campaign automation. It connects directly with platforms like Shopify and enables very granular customer segmentation based on purchase history.
    • Google Analytics 4: useful for customer segmentation based on website behavior. Its predictive audiences incorporate purchase propensity signals.
    • Segment or Amplitude: customer data platforms (CDP) that centralize behavioral events from multiple sources and allow you to build very precise microsegmentation segments.

    How to choose the right tool for your context

    The right choice depends on three specific variables. Choosing the wrong tool is not a technical problem: it is a problem of resources and team adoption.

    Variable Recommended tool Why
    Low budget (< €200/month) + ecommerce Klaviyo (basic plan) Native RFM, direct integration with Shopify/WooCommerce, low learning curve
    Medium budget + B2B with CRM HubSpot (Starter or Pro) Segmentation + lead scoring + automation in a single platform
    Large database (> 200k records) + multiple channels Segment or Amplitude CDP that centralizes heterogeneous sources and allows segments to be activated on any channel
    Zero budget + initial analysis Google Analytics 4 Free predictive audiences, direct export to Google Ads
    High data maturity + predictive models Amplitude + custom model (Python/R) Maximum flexibility for personalized predictive segmentation

    The most important criterion is not the budget or the size of the database: it is the integration with the CRM or ecommerce platform you already use. A perfect tool that does not connect with your existing data produces segments in a silo that no one activates.

    How to implement customer segmentation step by step

    Knowing what customer segmentation is and understanding its methods is not enough: the real value lies in executing it in an orderly way. This is the process we follow at Amara when we help a business segment from scratch.

    1. Define the business objective. Before touching any data, answer: why do you want to segment? The objective determines which criteria and which method are relevant to your customer segmentation.
    2. Collect and audit the available data. Take stock of what data you have and evaluate its quality and coverage. A segment is only as good as the data that supports it. Without reliable data, any customer classification lacks a solid foundation.
    3. Choose the criteria and the method. With the objective and the data on the table, select the criteria and the method. For a first segmentation with limited data, start with RFM or a priori.
    4. Build and name the segments. Apply the chosen method and generate the groups. Give them operational names that the team understands immediately. Verify that each group meets the four conditions: measurable, accessible, substantial and actionable.
    5. Validate the segments before activating them. Check that the groups have internal coherence and review their size. Verify with the sales team whether the profiles make sense in practice.
    6. Activate the segments in campaigns and measure. Translate each segment into concrete actions and monitor the key metrics by segment. Schedule a quarterly review to detect segments that have lost homogeneity.

    Common mistakes in customer segmentation

    Customer segmentation fails more due to execution errors than due to a lack of data. These are the three most common mistakes:

    Over-segmenting

    Creating too many segments in the hope of achieving maximum precision. The result is the opposite: the team does not have the capacity to execute differentiated strategies for each group. Start with three or four well-defined segments and add granularity only when you have the operational capacity to manage it.

    Not updating the segments

    Customer behavior changes: a VIP customer from two years ago may have reduced their purchase frequency and be at risk of churning. If you do not review the segments regularly — at least every quarter — your campaigns will continue to target groups that no longer exist. Customer segmentation is a continuous process, not a one-off project.

    Using criteria without sufficient data

    Segmenting by a criterion when only 5% of your database has that data produces a statistically irrelevant segment. Each criterion must be backed by data with sufficient coverage. If you do not have it, first use behavioral or demographic criteria that you can measure reliably.

    Customer segmentation and GDPR: privacy by design

    Customer segmentation based on personal data has direct legal implications in the UK and throughout the European Union. Ignoring them is not an option: lack of consent can constitute a serious or very serious infringement depending on each case.

    The key points you need to keep in mind:

    • Legal basis for processing. The European Union’s legal requirement is informed consent for appropriate use of data, as established by the GDPR. You cannot use behavioral data for segmentation if the user has not expressly accepted that purpose.
    • Specific purpose and limitation. You cannot use data collected to process an order to build a purchase behavior profile without additional consent.
    • Behavioral segmentation and advanced profiling. Advanced profiling requires a valid legal basis, which in most cases is consent. Personalizing communications based on user behavior is only legal if the user has expressly accepted that specific purpose.
    • Tools and suppliers. All tools that process personal data require a Data Processing Agreement. The company is responsible for ensuring that its suppliers comply with the regulations.

    Respecting GDPR requirements is not only a legal obligation, but also an opportunity to build more transparent relationships. Customer segmentation built on data with explicit consent produces more reliable segments and more receptive audiences.

    How to create truly effective segments?

    Linear process of creating effective segments: from raw data to validated and actionable buyer personas.
    An effective segment requires validation: it must be measurable (quantifiable size and characteristics), accessible (reachable with your channels) and profitable (with potential to respond to differentiated marketing actions).

    Creating a segment within your customer segmentation strategy is not just about grouping people: it is about building a category that makes strategic sense. For a segment to be effective, it must meet four conditions:

    • Measurable: you must be able to quantify its size and characteristics with the data you have.
    • Accessible: you must be able to reach that group through specific channels.
    • Substantial: it must be large enough to justify a differentiated strategy.
    • Actionable: you must be able to design specific actions for that segment that are different from those for the rest.

    In addition, review your segments regularly. Customer purchase behavior changes, and a segment that was relevant a year ago may have lost coherence. Customer segmentation is not a one-off exercise, but a continuous process.

    Metrics for evaluating the performance of your segments

    Defining segments is the starting point; measuring their performance is what closes the strategic cycle of customer segmentation. Once you activate your campaigns by segment, these are the metrics you should monitor:

    Conversion rate by segment

    Compare how many customers in each group complete the desired action. Differences between segments reveal which groups respond best to your current messages and which ones need adjustment. A variation of more than 50% between the highest and lowest converting segment indicates that the segmentation is working.

    Lifetime Value (LTV) by segment

    The total value a customer contributes during their relationship with the brand. Customer segmentation by LTV allows you to prioritize resources in the most profitable groups and design differentiated retention strategies. According to Forrester Research, companies that actively segment by LTV generate between 10% and 30% more recurring revenue.

    Churn rate by segment

    The abandonment rate broken down by group is one of the earliest signals that a segment has lost relevance. Crossing it with RFM allows you to anticipate customer loss before it happens, rather than reacting when it is already too late. Monitoring this metric is especially critical in any customer segmentation strategy focused on retention.

    Reactivation rate

    Measures what percentage of inactive customers in a segment responds to your recovery campaigns. A reactivation rate below 5% in win-back campaigns usually indicates that the inactive segment is too cold and that it is advisable to suppress those records from regular communications.

    Open rate and click rate by segment

    In email campaigns, these metrics indicate whether the message resonates with each group. A low open rate in a specific segment usually signals a relevance problem, not a volume problem.

    Reviewing these metrics periodically — at least every quarter — allows you to detect when a segment has lost homogeneity and needs to be redefined. A well-maintained customer segmentation improves progressively with each review cycle.

    How to apply segmentation to your marketing campaigns?

    Customer segmentation gains real value when it is translated into concrete actions. Once you have your segments defined, you can apply personalization at several levels:

    • Messages and creatives: adapt the copy, images and tone according to the motivations of each segment.
    • Distribution channels: some segments prefer email; others respond better to social media or organic search.
    • Offers and prices: design specific promotions for high-value customers or to recover inactive customers.
    • Educational content: if a segment is in the consideration stage of the customer journey, it needs different information from someone who is ready to buy.
    • Lookalike audiences: use your highest-LTV segments as a seed to identify new potential customers with analogous profiles on advertising platforms.

    For example, if your RFM analysis identifies a group of customers who purchased more than six months ago and have not returned, you can launch a reactivation campaign with a specific incentive, rather than including them in your general communication. Customer segmentation allows you to make this kind of decision with criteria and without wasting budget.

    Customer segmentation, well executed, not only improves the performance of your campaigns: it also reduces spending on poorly qualified audiences and strengthens the relationship with each type of customer. It is, in short, the foundation on which to build a truly differentiated marketing strategy.

    Frequently asked questions

    How many segments should I have as a starting point?

    It is advisable to start with three or four well-defined segments. Too many segments make execution difficult and dilute the team’s resources. As you gain operational capacity and performance data, you can add granularity progressively.

    How often should I review and update my segments?

    At least every quarter. Customer purchase behavior changes, and a segment that was relevant a year ago may have lost coherence. A segment that does not improve any metric compared to general communication does not justify the personalization effort and should be redefined.

    What is the difference between RFM segmentation and predictive segmentation?

    RFM segmentation classifies customers according to their past behavior (Recency, Frequency, Monetary Value) and is reactive: it describes what has already happened. Predictive segmentation applies machine learning models to anticipate future behaviors — purchase probability, churn risk, response to an offer — incorporating contextual signals that RFM does not capture. Both methods are complementary within a customer segmentation strategy.

    Can I use web behavioral data for segmentation without violating GDPR?

    Yes, but with conditions. Advanced profiling based on behavior requires a valid legal basis, which in most cases is the user’s explicit consent for that specific purpose. If the user only accepted basic analytics cookies, you cannot use that data to build behavioral segments for commercial purposes without additional specific consent.

    What is lead scoring and how does it relate to segmentation?

    Lead scoring is a scoring system that assigns each contact a rating based on their fit with the ideal profile (demographic or firmographic data) and their level of activity (behavior). It is the operational translation of customer segmentation in B2B environments: it converts segments into a prioritized list for the sales team, from highest to lowest probability of conversion.

    Sources

  • Segmentación de clientes: criterios, métodos y segmentos efectivos

    Segmentación de clientes: criterios, métodos y segmentos efectivos

    La segmentación de clientes es uno de los pilares del marketing moderno. Consiste en dividir tu base de clientes en grupos homogéneos para dirigirte a cada uno con mensajes, ofertas y canales adaptados a sus necesidades reales. Sin segmentación de clientes, cualquier campaña corre el riesgo de ser demasiado genérica para resultar efectiva. Según el informe State of Marketing de Salesforce, el 84 % de los clientes espera ser tratado como una persona, no como un número; y los equipos de marketing de alto rendimiento tienen 2,4 veces más probabilidades de personalizar sus comunicaciones a escala. McKinsey estima que la personalización basada en segmentación puede reducir los costes de adquisición hasta un 50 % y aumentar los ingresos entre un 5 % y un 15 %.

    ¿Qué es la segmentación de clientes y por qué importa?

    Segmentar significa agrupar personas con características o comportamientos similares dentro de un mercado más amplio. El objetivo de la segmentación de clientes no es clasificar por clasificar, sino identificar patrones que permitan personalizar la estrategia de marketing y ventas.

    Cuando conoces bien a cada segmento, puedes ajustar el mensaje, el canal y el momento de contacto. El resultado es una comunicación más relevante, una mayor tasa de conversión y una mejor experiencia para el cliente. Las empresas que implementan una segmentación de clientes efectiva pueden reducir costes de adquisición al enfocar recursos en audiencias con mayor probabilidad de conversión. En definitiva, la segmentación convierte datos en decisiones y abre la puerta a la personalización dinámica.

    ¿Cuáles son los principales criterios de segmentación?

    Existen cuatro grandes bloques de criterios que puedes combinar según tu negocio y los datos disponibles para llevar a cabo una segmentación de clientes eficaz.

    Criterios demográficos

    Son los más utilizados como punto de partida en cualquier proceso de segmentación de clientes. Incluyen variables como edad, género, nivel de ingresos, nivel educativo o situación familiar. Los criterios demográficos son fáciles de obtener y permiten construir perfiles básicos rápidamente.

    Por ejemplo, una marca de software de gestión puede segmentar por tamaño de empresa y cargo del decisor, diferenciando entre el autónomo que necesita simplicidad y el director financiero de una pyme que prioriza integraciones.

    Criterios geográficos

    La ubicación sigue siendo un criterio relevante en la segmentación de clientes, especialmente para negocios con presencia local o con ofertas que varían por región. Puedes segmentar por país, comunidad autónoma, ciudad o incluso por densidad de población.

    Un ecommerce, por ejemplo, puede adaptar sus promociones según la estacionalidad climática de cada zona geográfica.

    Criterios psicográficos

    Aquí entran los valores, el estilo de vida, los intereses y la personalidad del cliente. Este tipo de segmentación de clientes es más difícil de medir que la demográfica, pero ofrece una comprensión más profunda de las motivaciones de compra y del customer journey completo.

    Una marca de alimentación saludable, por ejemplo, no se dirige igual a alguien que practica deporte de forma competitiva que a alguien que busca mejorar su dieta por recomendación médica.

    Criterios conductuales

    El comportamiento de compra es uno de los criterios más valiosos en la segmentación de clientes. Analiza cómo interactúan los clientes con tu marca: frecuencia de compra, ticket medio, canales preferidos, respuesta a promociones o fase del ciclo de vida del cliente.

    Este tipo de segmentación permite identificar, por ejemplo, a los clientes de alto valor que compran con frecuencia pero nunca abren tus emails, y diseñar una estrategia específica para reactivarlos por otro canal. También es la base para medir la propensión a la compra y detectar el churn rate potencial.

    Segmentación B2B vs. B2C: diferencias clave

    La segmentación de clientes no funciona igual en todos los mercados. Cuando vendes a empresas (B2B), los criterios y el proceso de decisión cambian de forma sustancial respecto a cuando vendes a consumidores finales (B2C).

    Segmentación B2B

    En entornos B2B, los criterios más relevantes para la segmentación de clientes suelen ser el sector de actividad, el tamaño de la empresa, el cargo del interlocutor y la fase del proceso de compra. El ciclo de venta es más largo, intervienen varios decisores y la propensión a la compra depende tanto de factores racionales como de la relación con el proveedor.

    Un ejemplo típico: segmentar por facturación anual y número de empleados para diferenciar entre pymes que necesitan una solución llave en mano y grandes cuentas que requieren integración con sus sistemas existentes. En B2B, el lead scoring es el mecanismo que traduce la segmentación de clientes en priorización comercial.

    Segmentación B2C

    En entornos B2C, los criterios conductuales y psicográficos cobran más peso en la segmentación de clientes. El volumen de clientes es mayor, las decisiones son más rápidas y la microsegmentación permite afinar la comunicación con un coste marginal bajo.

    Un retailer de moda, por ejemplo, puede segmentar por historial de navegación, categorías consultadas y frecuencia de compra para lanzar campañas de reactivación hiperpersonalizadas. Las audiencias similares (lookalike) amplían esta lógica: a partir de un segmento de clientes de alto valor, las plataformas publicitarias identifican perfiles nuevos con comportamientos análogos.

    Segmentación por ciclo de vida del cliente

    Una de las aplicaciones más potentes de la segmentación de clientes es clasificar a los usuarios según la etapa de su relación con la marca. El ciclo de vida del cliente define qué necesita cada persona en cada momento, y permite diseñar acciones radicalmente distintas para grupos que, en términos demográficos, serían idénticos.

    Nuevo cliente

    Ha realizado su primera compra en los últimos 30-60 días. El objetivo prioritario es convertir esa primera transacción en un hábito: la segunda compra es el indicador más predictivo de retención a largo plazo, según estudios de Bain & Company. La acción recomendada es una secuencia de onboarding que eduque sobre el producto y facilite la segunda conversión con un incentivo de bajo coste.

    Cliente activo

    Compra con regularidad dentro de la ventana de frecuencia esperada para tu categoría. El riesgo aquí es la complacencia: asumir que seguirá comprando sin estímulo. Las acciones recomendadas son programas de fidelización, venta cruzada (cross-sell) y upsell basados en el historial de compra.

    Cliente en riesgo

    Su frecuencia de compra ha caído por debajo de la media del segmento o ha pasado más tiempo del habitual desde su última transacción. Detectar esta etapa antes de que el cliente abandone es el mayor retorno de la segmentación conductual: intervenir en riesgo cuesta entre 5 y 25 veces menos que recuperar a un cliente ya perdido (Harvard Business Review). La acción recomendada es una campaña de retención proactiva.

    Cliente inactivo

    No ha comprado en un período significativamente superior a su frecuencia histórica. En ecommerce, suele fijarse entre 6 y 12 meses. No todos los inactivos merecen el mismo esfuerzo de recuperación: prioriza los que tuvieron un LTV alto antes de caer en inactividad. La acción recomendada es una campaña de win-back con incentivo claro.

    Cliente recuperado

    Ha vuelto a comprar tras un período de inactividad. Es el segmento más frágil: tiene mayor probabilidad de volver a caer en inactividad que un cliente que nunca se fue. La acción recomendada es tratarlo como un nuevo cliente: secuencia de reactivación y seguimiento cercano en los primeros 60 días.

    Etapa Criterio de clasificación Señal de alerta Acción recomendada
    Nuevo Primera compra en los últimos 30-60 días No hay segunda compra tras 45 días Secuencia de onboarding + incentivo segunda compra
    Activo Frecuencia dentro de la ventana esperada Caída del ticket medio Cross-sell, upsell, programa de fidelización
    En riesgo Frecuencia por debajo de la media del segmento Tiempo sin compra supera la media histórica Campaña de retención proactiva, encuesta NPS
    Inactivo Sin compra en 6-12 meses (según sector) Sin apertura de emails en 90 días Win-back con incentivo; si no responde, suprimir
    Recuperado Compra tras período de inactividad Segunda inactividad en primeros 60 días Tratamiento como nuevo cliente + seguimiento cercano

    ¿Qué métodos existen para crear segmentos?

    Una vez definidos los criterios de segmentación de clientes, necesitas un método para construir los segmentos de forma sistemática. Los más habituales son:

    • Segmentación a priori: defines los grupos antes de analizar los datos, basándote en criterios conocidos. Es rápida y fácil de implementar, aunque puede resultar poco precisa.
    • Segmentación basada en clústeres: utilizas técnicas estadísticas o de machine learning para que los datos revelen agrupaciones naturales. Es más compleja, pero produce segmentos más ajustados a la realidad.
    • Segmentación RFM: clasifica a los clientes según Recencia, Frecuencia y Valor Monetario. Es especialmente útil en ecommerce y retail.
    • Segmentación predictiva: aplica modelos de machine learning sobre el historial de comportamiento para anticipar qué clientes tienen mayor probabilidad de comprar, de abandonar o de responder a una oferta concreta.
    • Buyer personas: representaciones semifictivas de los clientes ideales, construidas a partir de datos reales y entrevistas. Complementan la segmentación cuantitativa con una dimensión cualitativa y son el puente natural hacia la estrategia de contenidos.
    Método Complejidad Datos necesarios Caso de uso ideal
    A priori Baja Variables básicas (edad, sector, geografía) Primeras segmentaciones o recursos limitados
    Clústeres Alta Histórico de comportamiento y atributos múltiples Bases de datos grandes con patrones no evidentes
    RFM Media Historial de transacciones Ecommerce, retail y suscripciones
    Predictiva Alta Comportamiento histórico + señales contextuales Reducir churn, priorizar leads, personalización dinámica
    Buyer personas Media Entrevistas, encuestas y datos cualitativos Estrategia de contenidos y posicionamiento de marca

    Caso de uso real: segmentación RFM en un ecommerce de moda

    Este es un caso representativo —basado en patrones habituales en proyectos de segmentación de clientes para ecommerce de moda con bases de entre 50.000 y 150.000 registros— que ilustra el impacto real de pasar de comunicación masiva a segmentación RFM.

    Situación de partida: un ecommerce de moda con 80.000 clientes activos enviaba la misma newsletter semanal a toda la base. La tasa de apertura media era del 18 % y la tasa de conversión sobre envíos, del 1,2 %.

    Intervención: se aplicó un modelo RFM para clasificar la base en cinco segmentos operativos: campeones, leales en riesgo, compradores ocasionales, inactivos recientes e inactivos profundos. Cada segmento recibió una secuencia de comunicación diferente.

    Resultados tras 90 días:

    • La tasa de apertura media subió del 18 % al 29 % (+61 % relativo).
    • La tasa de conversión sobre envíos pasó del 1,2 % al 2,7 % (+125 % relativo).
    • El LTV medio del segmento de campeones creció un 22 % en el trimestre.
    • El coste por adquisición de cliente nuevo bajó a 27 € (–29 %).

    La clave no fue la tecnología, sino la disciplina de no enviar el mismo mensaje a todos. La segmentación de clientes no requiere inteligencia artificial para generar resultados: requiere criterios claros, datos limpios y voluntad de ejecutar de forma diferenciada.

    Herramientas para implementar la segmentación de clientes

    Panel de herramientas de segmentación con datos de clientes transformados en grupos visuales diferenciados por color.
    Las plataformas modernas de segmentación automatizan la clasificación de datos brutos en clusters cohesivos, reduciendo tiempo manual y mejorando precisión en la identificación de patrones de comportamiento.

    Conocer los métodos es solo la mitad del trabajo. La otra mitad es ejecutar la segmentación de clientes con las herramientas adecuadas:

    • HubSpot: ideal para la segmentación de clientes en entornos B2B. Permite crear listas dinámicas basadas en propiedades del contacto, comportamiento en el sitio web y etapa del ciclo de vida.
    • Klaviyo: referencia en ecommerce para segmentación RFM y automatización de campañas. Conecta directamente con plataformas como Shopify y facilita una segmentación de clientes muy granular a partir del historial de compra.
    • Google Analytics 4: útil para la segmentación de clientes a partir del comportamiento en el sitio web. Sus audiencias predictivas incorporan señales de propensión a la compra.
    • Segment o Amplitude: plataformas de datos de cliente (CDP) que centralizan eventos de comportamiento de múltiples fuentes y permiten construir segmentos de microsegmentación muy precisos.

    Cómo elegir la herramienta según tu contexto

    La elección correcta depende de tres variables concretas. Elegir la herramienta equivocada no es un problema técnico: es un problema de recursos y de adopción del equipo.

    Variable Herramienta recomendada Por qué
    Presupuesto bajo (< 200 €/mes) + ecommerce Klaviyo (plan básico) RFM nativo, integración directa con Shopify/WooCommerce, curva de aprendizaje baja
    Presupuesto medio + B2B con CRM HubSpot (Starter o Pro) Segmentación + lead scoring + automatización en una sola plataforma
    Base de datos grande (> 200k registros) + múltiples canales Segment o Amplitude CDP que centraliza fuentes heterogéneas y permite activar segmentos en cualquier canal
    Presupuesto cero + análisis inicial Google Analytics 4 Audiencias predictivas gratuitas, exportación directa a Google Ads
    Madurez de datos alta + modelos predictivos Amplitude + modelo propio (Python/R) Máxima flexibilidad para segmentación predictiva personalizada

    El criterio más importante no es el presupuesto ni el tamaño de la base de datos: es la integración con el CRM o la plataforma de ecommerce que ya usas. Una herramienta perfecta que no conecta con tus datos existentes produce segmentos en un silo que nadie activa.

    Cómo implementar la segmentación de clientes paso a paso

    Saber qué es la segmentación de clientes y conocer sus métodos no basta: el valor real está en ejecutarla de forma ordenada. Este es el proceso que seguimos en Amara cuando ayudamos a un negocio a segmentar desde cero.

    1. Define el objetivo de negocio. Antes de tocar ningún dato, responde: ¿para qué quieres segmentar? El objetivo determina qué criterios y qué método son relevantes en tu segmentación de clientes.
    2. Recopila y audita los datos disponibles. Inventaría qué datos tienes y evalúa su calidad y cobertura. Un segmento solo es tan bueno como los datos que lo sostienen. Sin datos fiables, cualquier clasificación de clientes carece de base sólida.
    3. Elige los criterios y el método. Con el objetivo y los datos sobre la mesa, selecciona los criterios y el método. Para una primera segmentación con datos limitados, empieza por RFM o a priori.
    4. Construye y nombra los segmentos. Aplica el método elegido y genera los grupos. Ponles nombres operativos que el equipo entienda de inmediato. Verifica que cada grupo cumple las cuatro condiciones: medible, accesible, sustancial y accionable.
    5. Valida los segmentos antes de activarlos. Comprueba que los grupos tienen coherencia interna y revisa el tamaño. Contrasta con el equipo comercial si los perfiles tienen sentido en la práctica.
    6. Activa los segmentos en campañas y mide. Traduce cada segmento en acciones concretas y monitoriza las métricas clave por segmento. Programa una revisión trimestral para detectar segmentos que han perdido homogeneidad.

    Errores frecuentes en la segmentación de clientes

    La segmentación de clientes falla más por errores de ejecución que por falta de datos. Estos son los tres fallos más habituales:

    Sobre-segmentar

    Crear demasiados segmentos con la esperanza de afinar al máximo. El resultado es el contrario: el equipo no tiene capacidad para ejecutar estrategias diferenciadas para cada grupo. Empieza con tres o cuatro segmentos bien definidos y añade granularidad solo cuando tengas capacidad operativa para gestionarla.

    No actualizar los segmentos

    El comportamiento de los clientes cambia: un cliente VIP de hace dos años puede haber reducido su frecuencia de compra y estar en riesgo de churn. Si no revisas los segmentos con regularidad —al menos cada trimestre—, tus campañas seguirán dirigiéndose a grupos que ya no existen. La segmentación de clientes es un proceso continuo, no un proyecto puntual.

    Usar criterios sin datos suficientes

    Segmentar por un criterio cuando solo el 5 % de tu base tiene ese dato produce un segmento estadísticamente irrelevante. Cada criterio debe estar respaldado por datos con cobertura suficiente. Si no los tienes, usa primero criterios conductuales o demográficos que sí puedas medir con fiabilidad.

    Segmentación de clientes y RGPD: privacidad desde el diseño

    La segmentación de clientes basada en datos personales tiene implicaciones legales directas en España y en toda la Unión Europea. Ignorarlas no es una opción: la falta de consentimiento puede constituir una infracción grave o muy grave según cada caso.

    Los puntos clave que debes tener en cuenta:

    • Base legal para el tratamiento. La exigencia legal de la Unión Europea es el consentimiento informado para un uso adecuado de los datos, tal y como lo establece el RGPD. No puedes usar datos de comportamiento para segmentar si el usuario no ha aceptado expresamente esa finalidad.
    • Finalidad específica y limitación. No puedes usar datos recogidos para gestionar un pedido para construir un perfil de comportamiento de compra sin consentimiento adicional.
    • Segmentación conductual y perfilado avanzado. El perfilado avanzado exige una base legal válida, que en la mayoría de los casos es el consentimiento. Personalizar comunicaciones basándose en el comportamiento del usuario solo es legal si este ha aceptado expresamente esa finalidad.
    • Herramientas y proveedores. Todas las herramientas que traten datos personales requieren un Contrato de Encargado de Tratamiento. La empresa es responsable de garantizar que sus proveedores cumplen la normativa.

    Respetar las exigencias del RGPD no solo es una obligación legal, sino también una oportunidad para construir relaciones más transparentes. Una segmentación de clientes construida sobre datos con consentimiento explícito produce segmentos más fiables y audiencias más receptivas.

    ¿Cómo crear segmentos realmente efectivos?

    Proceso lineal de creación de segmentos efectivos: desde datos brutos hasta buyer personas validados y accionables.
    Un segmento efectivo requiere validación: debe ser medible (tamaño y características cuantificables), accesible (alcanzable con tus canales) y rentable (con potencial de respuesta a acciones de marketing diferenciadas).

    Crear un segmento dentro de tu estrategia de segmentación de clientes no es solo agrupar personas: es construir una categoría que tenga sentido estratégico. Para que un segmento sea efectivo, debe cumplir cuatro condiciones:

    • Medible: debes poder cuantificar su tamaño y características con los datos que tienes.
    • Accesible: debes poder llegar a ese grupo a través de canales concretos.
    • Sustancial: debe ser lo suficientemente grande como para justificar una estrategia diferenciada.
    • Accionable: debes poder diseñar acciones específicas para ese segmento que sean distintas de las del resto.

    Además, revisa tus segmentos con regularidad. El comportamiento de compra de los clientes cambia, y un segmento que era relevante hace un año puede haber perdido coherencia. La segmentación de clientes no es un ejercicio puntual, sino un proceso continuo.

    Métricas para evaluar el rendimiento de tus segmentos

    Definir segmentos es el punto de partida; medir su rendimiento es lo que cierra el ciclo estratégico de la segmentación de clientes. Una vez que activas tus campañas por segmento, estas son las métricas que debes monitorizar:

    Tasa de conversión por segmento

    Compara cuántos clientes de cada grupo completan la acción deseada. Las diferencias entre segmentos revelan qué grupos responden mejor a tus mensajes actuales y cuáles necesitan ajuste. Una variación superior al 50 % entre el segmento de mayor y menor conversión indica que la segmentación está funcionando.

    Lifetime Value (LTV) por segmento

    El valor total que un cliente aporta durante su relación con la marca. La segmentación de clientes por LTV te permite priorizar recursos en los grupos más rentables y diseñar estrategias de retención diferenciadas. Según Forrester Research, las empresas que segmentan activamente por LTV obtienen entre un 10 % y un 30 % más de ingresos recurrentes.

    Churn rate por segmento

    La tasa de abandono desagregada por grupo es una de las señales más tempranas de que un segmento ha perdido relevancia. Cruzarla con el RFM permite anticipar la pérdida de clientes antes de que se produzca, no reaccionar cuando ya es tarde. Monitorizar esta métrica es especialmente crítico en cualquier estrategia de segmentación de clientes orientada a la retención.

    Tasa de reactivación

    Mide qué porcentaje de clientes inactivos de un segmento responde a tus campañas de recuperación. Una tasa de reactivación inferior al 5 % en campañas de win-back suele indicar que el segmento inactivo está demasiado frío y que conviene suprimir esos registros de las comunicaciones habituales.

    Tasa de apertura y clic por segmento

    En campañas de email, estas métricas indican si el mensaje resuena con cada grupo. Una tasa de apertura baja en un segmento concreto suele señalar un problema de relevancia, no de volumen de envíos.

    Revisar estas métricas de forma periódica —al menos cada trimestre— te permite detectar cuándo un segmento ha perdido homogeneidad y necesita redefinirse. Una segmentación de clientes bien mantenida mejora progresivamente con cada ciclo de revisión.

    ¿Cómo aplicar la segmentación a tus campañas de marketing?

    La segmentación de clientes cobra valor real cuando se traduce en acciones concretas. Una vez que tienes tus segmentos definidos, puedes aplicar la personalización en varios niveles:

    • Mensajes y creatividades: adapta el copy, las imágenes y el tono según las motivaciones de cada segmento.
    • Canales de distribución: algunos segmentos prefieren el email; otros responden mejor a redes sociales o a la búsqueda orgánica.
    • Ofertas y precios: diseña promociones específicas para clientes de alto valor o para recuperar clientes inactivos.
    • Contenido educativo: si un segmento está en fase de consideración dentro del customer journey, necesita información diferente a la de alguien listo para comprar.
    • Audiencias similares (lookalike): usa tus segmentos de mayor LTV como semilla para identificar nuevos clientes potenciales con perfiles análogos en plataformas publicitarias.

    Por ejemplo, si tu análisis RFM identifica un grupo de clientes que compraron hace más de seis meses y no han vuelto, puedes lanzar una campaña de reactivación con un incentivo específico, en lugar de incluirlos en tu comunicación general. La segmentación de clientes te permite tomar esta clase de decisiones con criterio y sin desperdiciar presupuesto.

    La segmentación de clientes, bien ejecutada, no solo mejora el rendimiento de tus campañas: también reduce el gasto en audiencias poco cualificadas y fortalece la relación con cada tipo de cliente. Es, en definitiva, la base sobre la que construir una estrategia de marketing verdaderamente diferenciada.

    Preguntas frecuentes

    ¿Cuántos segmentos debería tener como punto de partida?

    Lo recomendable es empezar con tres o cuatro segmentos bien definidos. Demasiados segmentos dificultan la ejecución y diluyen los recursos del equipo. A medida que ganas capacidad operativa y datos de rendimiento, puedes añadir granularidad de forma progresiva.

    ¿Con qué frecuencia debo revisar y actualizar mis segmentos?

    Al menos cada trimestre. El comportamiento de compra de los clientes cambia, y un segmento que era relevante hace un año puede haber perdido coherencia. Un segmento que no mejora ninguna métrica respecto a la comunicación general no justifica el esfuerzo de personalización y debe redefinirse.

    ¿Qué diferencia hay entre segmentación RFM y segmentación predictiva?

    La segmentación RFM clasifica a los clientes según su comportamiento pasado (Recencia, Frecuencia, Valor Monetario) y es reactiva: describe lo que ya ha ocurrido. La segmentación predictiva aplica modelos de machine learning para anticipar comportamientos futuros —probabilidad de compra, riesgo de churn, respuesta a una oferta— incorporando señales contextuales que el RFM no captura. Ambos métodos son complementarios dentro de una estrategia de segmentación de clientes.

    ¿Puedo usar datos de comportamiento web para segmentar sin infringir el RGPD?

    Sí, pero con condiciones. El perfilado avanzado basado en comportamiento exige una base legal válida, que en la mayoría de los casos es el consentimiento explícito del usuario para esa finalidad concreta. Si el usuario solo aceptó cookies de analítica básica, no puedes usar esos datos para construir segmentos de comportamiento con fines comerciales sin un consentimiento adicional específico.

    ¿Qué es el lead scoring y cómo se relaciona con la segmentación?

    El lead scoring es un sistema de puntuación que asigna a cada contacto una valoración según su encaje con el perfil ideal (datos demográficos o firmográficos) y su nivel de actividad (comportamiento). Es la traducción operativa de la segmentación de clientes en entornos B2B: convierte los segmentos en una lista priorizada para el equipo comercial, de mayor a menor probabilidad de conversión.

    Fuentes

  • Enterprise RAG: architecture, tools, GDPR and costs for SMEs

    Enterprise RAG: architecture, tools, GDPR and costs for SMEs

    If you’ve ever spent twenty minutes searching for an internal procedure that “was in some PDF somewhere”, you know exactly the problem that enterprise RAG solves. RAG — short for Retrieval-Augmented Generation — is the artificial intelligence architecture that connects a language model with your own internal documents so that any team member can ask questions in natural language and get precise, cited, and verifiable answers.

    What is enterprise RAG and why does it matter now?

    Enterprise RAG is an architecture that combines semantic search in vector databases with natural language generation, allowing models like Claude or GPT-4o to respond with verifiable information from your own sources instead of making up data. In practice, this means the AI doesn’t “know” things from memory: it searches your documents before responding.

    The difference from a generic chatbot is fundamental. A conventional chatbot only responds with the model’s general knowledge, does not access internal documents, and can “hallucinate” answers when it lacks information. Enterprise RAG, on the other hand, responds with company-specific information, cites exact sources, and is far more accurate for business use cases. This precision is precisely what makes enterprise RAG such a relevant solution for teams managing complex internal documentation.

    Why does it matter now? Because a 20-person SME loses between 40 and 80 hours per week searching for internal documents — between 2 and 4 hours per person per week, according to McKinsey. Enterprise RAG turns that lost time into queries resolved in seconds.

    How does intelligent search work under the hood?

    Understanding the mechanics of enterprise RAG doesn’t require being a data engineer. The process follows three steps that chain together automatically every time someone asks a question.

    Step 1: document indexing and vectorisation

    The system first processes all your internal documents — PDFs, wikis, spreadsheets, manuals — and converts them into numerical representations called embeddings. These vectors are organised in a multidimensional mathematical space where semantically close fragments end up nearer to each other. This vector database is the heart of the system.

    Dividing documents into appropriately sized fragments — chunking — is essential in any enterprise RAG implementation: if the fragments are too large, the embeddings become too general and do not match user queries well. Getting the fragment size right makes the difference between precise and vague answers. Some advanced pipelines combine vector search with classic BM25 — known as hybrid search — to improve precision in corpora with very specific terminology.

    Step 2: semantic retrieval and reranking

    When a user submits a query, enterprise RAG converts the question into a vector representation (embedding) and searches the database for the most similar fragments. This search is fast and highly relevant thanks to vector similarity algorithms. In more advanced implementations, a reranking step reorders the retrieved fragments before passing them to the model, improving result relevance without increasing the cost of the initial search.

    The key here is that the search is semantic, not literal. If you ask “what are our warranty conditions for the retail sector?”, the system doesn’t look for that exact phrase: it understands the meaning and retrieves relevant fragments even if they use different vocabulary. This is what differentiates the intelligent search of enterprise RAG from a simple Ctrl+F in your folders.

    Step 3: generation with verifiable context

    With the data retrieved from the knowledge base, the system creates a new prompt for the language model that includes the user’s original query plus the enriched context. The size of that context — the context window — limits how many fragments the model can process at once, which makes chunking and reranking decisive. The result is a natural language response that cites the source document, not an invented answer. In agentic RAG architectures, the system can also chain multiple searches autonomously to answer complex questions that require crossing several sources.

    What real problems does it solve in an SME?

    Enterprise RAG is not a solution in search of a problem. There are concrete use cases where the return is immediate and measurable.

    • Onboarding new employees: new employees consult manuals, regulations, and procedures without interrupting anyone, and the enterprise RAG assistant cites the exact source document.
    • Internal customer support: the assistant searches your documentation — PDFs, Confluence, SharePoint, Notion — before responding. Any support agent has the correct answer in seconds.
    • Legal and compliance: semantic search over contracts and policies delivers the exact document quote and page number; for companies undergoing certification, having the regulatory corpus queryable via enterprise RAG accelerates audits such as ISO 27001.
    • Commercial knowledge management: the sales team can ask “what proposal did we send to the hospitality sector last year?” and get the document in seconds, ready to adapt.
    • Development and IT: runbooks, architecture decisions, postmortems, and incident history queryable in natural language. A well-built knowledge graph over this corpus also enables discovery of system dependencies that would otherwise remain buried in scattered documents.

    How does RAG differ from fine-tuning?

    Visual comparison: RAG retrieves documents for real-time queries versus fine-tuning which adjusts the model through training
    RAG is faster to implement and update (documents change without retraining), while fine-tuning requires labelled data and costly retraining.

    This is one of the most frequent questions when a company starts exploring AI applied to its internal documents. The confusion is understandable, but the difference is decisive for making the right choice.

    Unlike fine-tuning, enterprise RAG updates knowledge in real time without retraining models. This means that when you update an internal procedure, you simply upload the new document to the system and RAG incorporates it immediately. With fine-tuning, you would need to retrain the entire model, which involves cost, time, and advanced technical knowledge.

    For the vast majority of SMEs, enterprise RAG is the right choice: lower investment, launch in weeks, and the ability to update knowledge simply by uploading new documents to the system. Fine-tuning makes sense when you need the model to adopt a very specific style or work with highly specialised terminology, but for internal information retrieval, enterprise RAG wins in almost every scenario.

    Embedding models: the technical decision that most affects cost and privacy

    Choosing the embedding model is as important as choosing the LLM, yet it is the decision most often made by default. The embedding model determines the quality of vectorisation, the cost per indexed document, and — critically — whether data leaves your infrastructure or not.

    Embedding model Dimensions Privacy / data residency Indicative cost Best for
    OpenAI text-embedding-3-small 1,536 Cloud API; EU residency from Feb. 2025 ~$0.02 / million tokens SMEs already using OpenAI that prioritise ease of integration
    OpenAI text-embedding-3-large 3,072 Cloud API; EU residency from Feb. 2025 ~$0.13 / million tokens Large corpora where semantic precision is critical
    Cohere Embed v3 1,024 Cloud API; private deployment option ~$0.10 / million tokens Multilingual corpora (Spanish included) and hybrid search
    nomic-embed-text 768 Open source; 100% on-premise Own compute cost (no licence) Maximum privacy; teams with their own GPU or dedicated VPS
    BGE-M3 (BAAI) 1,024 Open source; 100% on-premise Own compute cost (no licence) Technical or legal corpora in Spanish with specific terminology

    The practical rule is simple: if documents contain personal data, open source on-premise models eliminate the debate about international data transfers. If the corpus is technical or product-related without sensitive data, OpenAI’s text-embedding-3-small offers a quality-to-cost ratio that is hard to beat. For corpora in Spanish with legal or medical terminology, Cohere Embed v3 and BGE-M3 typically outperform OpenAI models in semantic precision.

    What tools do you need to implement RAG in your company?

    A custom-built enterprise RAG implementation relies on three technology layers. You don’t need to build them from scratch: there are mature solutions for each one.

    Vector database

    This is where your documents’ embeddings are stored. The most common options for SMEs are Pinecone (managed SaaS, no own infrastructure), Qdrant (open source, can be deployed on-premise for greater privacy), and pgvector. If your company already uses PostgreSQL, you don’t need to contract a new database: just install the pgvector extension and you’re done. For 90% of companies, this is sufficient.

    Language model (LLM)

    This is the component that generates the natural language response from the retrieved context. GPT and Claude remain the reference models for complex reasoning; their price has dropped dramatically compared to previous years. For companies with strict privacy requirements, open source models such as Meta’s Llama or Mistral have reached a level where they can run enterprise RAG correctly on their own infrastructure.

    Orchestration framework

    LangChain and LlamaIndex are the most widely used frameworks for connecting all pipeline components — indexing, retrieval, reranking, generation — without having to code each piece from scratch. For teams without developers, platforms like Flowise or n8n allow building RAG flows visually, significantly reducing the technical barrier.

    Which enterprise RAG stack fits your profile? Decision tree

    Before evaluating tools, answer these three questions in order. Each branch leads to a concrete recommendation and prevents you from spending time analysing options that don’t fit your actual situation.

    1. Do you have developers on the team (or budget to hire them)?

      • No → Go directly to a no-code SaaS platform: Guru if you need human-verified knowledge, Vectara if you prioritise hallucination control via API without code. Both have connectors for Google Workspace and Microsoft 365.
      • Yes → Move to question 2.
    2. Does the corpus contain personal data (contracts, files, records)?

      • Yes → You need an on-premise or private cloud architecture. Recommended stack: pgvector + LangChain + Llama/Mistral on your own VPS or server. Embedding model: nomic-embed-text or BGE-M3. Zero data leaves your infrastructure.
      • No → Move to question 3.
    3. Does the corpus exceed 5,000 documents or do you need to connect more than five different sources?

      • Yes → Consider Glean (native connectors for 100+ apps, permission inheritance included) or a custom stack with Qdrant + LlamaIndex for greater control.
      • No → A pilot with pgvector + LangChain + OpenAI text-embedding-3-small + GPT-4o mini is sufficient to validate the concept. API cost: under €50 per month in the pilot phase.

    SaaS RAG platforms: when to buy instead of build

    Not all SMEs have the technical capacity to build a RAG pipeline from scratch. For them, SaaS RAG platforms are the fastest route to production: connect your data sources, configure permissions, and start querying, without managing infrastructure. Buying makes sense when RAG is an internal capability for the team: connectors, permission inheritance, audit logs, and SSO integration are non-trivial components to build and even harder to maintain.

    Platform Ideal profile Privacy / EU data Ease of deployment Indicative price
    Glean Mid-to-large companies with many apps (Slack, Drive, Jira, Confluence…) Cloud; review DPA for GDPR High — native connectors for 100+ apps Custom quote (enterprise)
    Guru Teams that need human-verified and curated knowledge Cloud; SOC 2; check residency High — no-code interface, verification every 90 days From ~$10/user/month (Starter plan)
    Vectara Technical teams wanting RAG-as-a-Service via API with hallucination control Cloud SaaS; review DPA Medium — requires API integration Free plan + pay-as-you-go paid plans
    Flowise / n8n SMEs with some technical profile wanting to build RAG flows visually Self-hosted available (maximum control) Medium-high — visual interface, no code Open source; cloud from ~$35/month
    Custom stack (pgvector + LangChain + LLM API) Teams with developers needing full pipeline control On-premise or own cloud Low — requires development API cost + team time

    For teams that want RAG without infrastructure management, Vectara and Glean are the fastest paths to production: upload documents, start querying, no pipeline engineering. Guru, for its part, requires internal experts to review and re-approve knowledge cards on a fixed cycle — typically every 90 days; if a card expires without verification, the AI agent cannot use it, resulting in a verified RAG based only on reliable and up-to-date content. Both Guru and Glean have native connectors for Google Workspace and Microsoft 365, the two most common ecosystems in SMEs, eliminating the need for manual integration work.

    GDPR and EU data residency: the barrier nobody mentions

    GDPR compliance scheme in enterprise RAG: data flow, permissions and EU residency
    GDPR compliance in an enterprise RAG system depends on where data resides, which fragments are sent to the LLM, and what data processing agreements exist with providers.

    For an SME, the question of privacy is not optional: it is a real adoption barrier. When an enterprise RAG system processes documents containing personal data — client contracts, employee records, support histories — it falls within the scope of the GDPR and, since 2024, also the EU AI Act.

    The Spanish Data Protection Agency (AEPD) published its guide on the use of artificial intelligence and data protection in 2024, reminding that any system that processes personal data — including fragments sent to an LLM — must have a legal basis, a record of processing activities, and, where applicable, a data protection impact assessment (DPIA). ENISA, for its part, noted in its AI threat report that data exfiltration through third-party APIs is one of the most underestimated risk vectors in generative AI deployments at European companies.

    In practice, there are three architectural decisions that determine your level of risk:

    • On-premise or private cloud: your documents never leave your infrastructure. This is the safest option for highly sensitive data and eliminates the debate about international transfers. Open source models like Llama or Mistral make this viable without licence costs.
    • LLM API with EU residency: EU data residency for OpenAI arrived for data at rest in February 2025 and was extended to inference within the European region in January 2026, although granularity is regional, not by specific country. Microsoft Copilot keeps data within the EU Data Boundary. In both cases, you must sign a DPA (data processing agreement) with the provider before indexing any document containing personal data.
    • SaaS RAG platforms: always check whether they offer a DPA, in which region data resides, and whether they hold certifications such as SOC 2 or ISO 27001. No solution is GDPR-compliant on its own; the company remains the data controller under Article 24 of Regulation (EU) 2016/679.

    The practical recommendation: before indexing any document, classify the corpus according to whether it contains personal data. Purely technical or product documents can go to a cloud solution without issue; employee records or client contracts deserve an on-premise architecture or, at minimum, a provider with a signed DPA and verified EU residency.

    How to implement RAG step by step in an SME?

    Implementing enterprise RAG in an SME follows a logical sequence that moves from the simplest to the most complex. Here is the practical roadmap.

    1. Document audit: identify which knowledge bases exist (Drive, SharePoint, Notion, local PDFs), what state they are in, and which generate the most repetitive queries. The quality of the corpus determines the quality of enterprise RAG.
    2. Pilot use case definition: choose a single department or process — for example, onboarding new employees or support team FAQs — with relatively well-organised documentation.
    3. Technology stack selection: for an enterprise RAG pilot in an SME, a combination such as pgvector + LangChain + OpenAI or Claude API is sufficient to validate the concept without over-engineering. If there is no technical team, consider a SaaS platform like Guru or Vectara.
    4. Indexing and chunking: process the documents, divide them into coherent fragments, and generate the embeddings. Knowledge bases must be continuously updated to maintain the quality and relevance of the system.
    5. Query pipeline construction: configure the complete flow: question intake → semantic search (or hybrid search) → reranking → fragment retrieval → response generation with source citation.
    6. Evaluation and metrics: see the specific section below.
    7. Deployment and governance: an enterprise RAG architecture must address security, permissions, traceability, and data governance. Define who accesses which documents and how queries are audited.

    Production system maintenance: the lifecycle nobody explains

    Deploying the pilot is only half the work. An enterprise RAG system in production degrades if not actively maintained, because documents change, models are updated, and the corpus grows in a disorganised way.

    These are the four processes you must have covered from day one:

    • Document versioning and reindexing: when an internal procedure changes, the old document must be marked as obsolete and the new one must be reindexed immediately. If you don’t have this process automated, the system will start responding with outdated information without anyone noticing. Tools like LlamaIndex allow configuring incremental reindexing so that only modified documents are processed, not the entire corpus.
    • Obsolescence management: establish an expiry policy for each document type. A product manual may have a six-month validity; an internal HR policy, one year. Guru handles this with its 90-day verification cycle; in custom stacks, you need to implement it yourself.
    • Corpus drift monitoring: when the document volume grows significantly, the semantic distribution of the corpus changes and embeddings generated months ago may lose precision. A monthly sample of 20–30 reference queries detects these drifts before they impact users.
    • Model updates: when the provider releases a new version of the embedding model or LLM, evaluate whether it is worth reindexing the entire corpus. Switching from text-embedding-3-small to text-embedding-3-large, for example, requires regenerating all vectors; the cost is low, but the process must be planned.

    How to measure whether your enterprise RAG is working well: metrics and evaluation

    “The system responds” is not enough. An enterprise RAG system in production needs concrete metrics to detect degradations before users notice them.

    The four key metrics of the RAGAS framework

    Imagine your RAG system is a researcher looking up information for you. RAGAS measures two things: whether the researcher found the right documents (retrieval) and whether they then faithfully reported what they found (generation). If it fails on the first, the answer will be incomplete; if it fails on the second, the answer will be fabricated even if the documents were correct.

    • Faithfulness: measures whether each claim in the response is supported by the retrieved fragments. Think of it as the percentage of sentences in the response that you can underline in the source documents. A threshold of 0.85 is the standard in production; if the weekly average drops more than 5%, investigate.
    • Context Precision: proportion of retrieved fragments that are genuinely relevant to the question. A low value indicates that reranking or chunking needs adjustment.
    • Context Recall: proportion of the knowledge needed to answer that the system has managed to retrieve. A low value indicates that the corpus is incomplete or poorly indexed.
    • Answer Relevancy: measures whether the generated response is pertinent to the original question, regardless of whether it is faithful to the context.

    Typical reference thresholds in production are: faithfulness 0.75, answer relevancy 0.80, context precision 0.70, context recall 0.80. Faithfulness is the metric that separates a hallucination-prone system from a reliable one: all the others exist to keep it at acceptable levels.

    Evaluation tools

    RAGAS provides the conceptual framework; DeepEval adds CI/CD integration; Patronus, Langfuse, and Lynx cover specific gaps in hallucination detection, production traceability, and bias evaluation. For teams just starting out, RAGAS or DeepEval are the best option for volumes of up to ~2,000 weekly evaluations if you already use Grafana or Datadog.

    The recommended cadence: a set of 50–100 reference questions with expected answers run on every pipeline change, plus a 1% sample of real production traffic to detect silent degradations from corpus or model drift.

    What are the most common mistakes when implementing RAG?

    Knowing common mistakes before you start saves time and money. These are the ones that appear most regularly in enterprise RAG projects.

    • Disorganised or outdated corpus: enterprise RAG amplifies the quality of your documents, it doesn’t fix it. If manuals have three contradictory versions, the system will return contradictory answers. Before indexing, clean and version your documents.
    • Ignoring chunking: poor document fragmentation is the most common cause of imprecise answers. A fragment that is too small loses context; one that is too large saturates the model’s context window.
    • Neglecting latency: the retrieval step prior to generation can increase response time; to mitigate this, optimise indexing and the search engine, and implement smart caches that reduce repetitive queries.
    • Not defining permissions from the start: in an SME, not all employees should access all documents. Designing access control after the fact is far more costly than including it from day one.
    • Not measuring: deploying without evaluation metrics (faithfulness, context precision) is a blind bet. Hallucinations don’t disappear with RAG: a Stanford study on RAG legal systems in production found non-trivial hallucination rates even in leading commercial platforms; they were still better than a base LLM alone, but they were not infallible.
    • Trying to cover everything at once: a scoped pilot with clear metrics is more valuable than a global deployment without success criteria.

    How much does it cost to implement enterprise RAG in an SME?

    The cost varies depending on scope, the chosen stack, and whether development is outsourced or done internally. However, there are useful indicative ranges for planning.

    For an SME, an enterprise RAG pilot in the initial phase has a development cost of between €6,000 and €15,000 if outsourced, plus language model API costs, which at this stage are almost negligible — tens of euros per month. From there, scalability depends on document volume and the number of concurrent users.

    For teams with internal technical capacity, the cost of enterprise RAG can be significantly reduced using open source tools and local models. The real investment in that case is team time, not software licences. In any scenario, the return is measured in recovered hours: if a ten-person team stops losing two hours per week searching for documents, the annual saving far exceeds the pilot investment.

    Frequently asked questions about enterprise RAG

    Do I need a data science team to implement RAG in my company?

    Not necessarily. For a basic enterprise RAG pilot, a developer with Python knowledge and familiarity with APIs can build a functional RAG pipeline using frameworks like LangChain or LlamaIndex. For companies without their own technical team, there are no-code platforms like Flowise or specialised SaaS solutions like Guru or Vectara that lower the barrier to entry. The key is to start with a scoped use case and a clean corpus.

    Will my internal documents be safe if I implement RAG?

    Security depends on the chosen architecture. If you opt for an on-premise solution or your own private cloud, your documents never leave your infrastructure. If you use external language model APIs, text fragments are sent to the provider to generate the response, so you must review their privacy policies, sign a DPA, and verify EU data residency. For highly sensitive information, local open source models are the safest option from a GDPR perspective.

    What types of documents can a RAG system index?

    A well-configured enterprise RAG system can index virtually any textual format: PDFs, Word documents, Notion or Confluence pages, spreadsheets, emails, meeting transcripts, internal web pages, and structured databases. The condition is that the content is extractable as text. Scanned documents without OCR or images without alternative text require a prior processing step.

    How long does it take to implement a RAG pilot?

    A well-scoped enterprise RAG pilot — a single department, a corpus of fewer than 500 documents, a defined use case — can be operational in four to eight weeks. The actual time depends mainly on the state of the source documentation: if documents are organised and up to date, indexing is fast; if the corpus needs cleaning and versioning first, the timeline extends. The subsequent evaluation and adjustment phase typically requires an additional two to three weeks.

    What is hybrid search and when should it be used in RAG?

    Hybrid search combines vector search (semantic) with BM25 search (classic lexical) to improve retrieval in corpora with very specific terminology — product names, internal codes, acronyms — where purely semantic search may fail. It is especially useful in legal, technical, or compliance environments where exact terms matter as much as meaning. Most modern frameworks (LangChain, LlamaIndex, Haystack) support it natively.

  • RAG empresarial: arquitectura, herramientas, RGPD y costes para pymes

    RAG empresarial: arquitectura, herramientas, RGPD y costes para pymes

    Si alguna vez has perdido veinte minutos buscando un procedimiento interno que «estaba en algún PDF», sabes exactamente el problema que resuelve el RAG empresarial. RAG —siglas de Retrieval-Augmented Generation— es la arquitectura de inteligencia artificial que conecta un modelo de lenguaje con tus propios documentos internos para que cualquier miembro del equipo pueda hacer preguntas en lenguaje natural y obtener respuestas precisas, citadas y verificables.

    ¿Qué es el RAG empresarial y por qué importa ahora?

    El RAG empresarial es una arquitectura que combina búsqueda semántica en bases de datos vectoriales con generación de lenguaje natural, permitiendo que modelos como Claude o GPT-4o respondan con información verificable de fuentes propias en lugar de inventar datos. En la práctica, esto significa que la IA no «sabe» las cosas de memoria: las busca en tus documentos antes de responder.

    La diferencia con un chatbot genérico es fundamental. Un chatbot convencional solo responde con el conocimiento general del modelo, no accede a documentos internos y puede «alucinar» respuestas si no tiene información. El RAG empresarial, en cambio, responde con información específica de tu empresa, cita fuentes exactas y es mucho más preciso para casos empresariales. Esta precisión es precisamente lo que hace del RAG empresarial una solución tan relevante para equipos que gestionan documentación interna compleja.

    ¿Por qué importa ahora? Porque una pyme de 20 personas pierde entre 40 y 80 horas semanales buscando documentos internos —entre 2 y 4 horas por persona a la semana, según McKinsey. El RAG empresarial convierte ese tiempo perdido en consultas resueltas en segundos.

    ¿Cómo funciona la búsqueda inteligente por dentro?

    Entender la mecánica del RAG empresarial no requiere ser ingeniero de datos. El proceso sigue tres pasos que se encadenan de forma automática cada vez que alguien hace una pregunta.

    Paso 1: indexación y vectorización de documentos

    El sistema primero procesa todos tus documentos internos —PDFs, wikis, hojas de cálculo, manuales— y los convierte en representaciones numéricas llamadas embeddings. Estos vectores se organizan en un espacio matemático multidimensional donde los fragmentos semánticamente próximos quedan más cercanos entre sí. Esta base de datos vectorial es el corazón del sistema.

    Dividir los documentos en fragmentos de tamaño adecuado —chunking— es esencial en cualquier implementación de RAG empresarial: si los fragmentos son demasiado grandes, los embeddings se vuelven demasiado generales y no corresponden bien con las consultas del usuario. Un buen ajuste del tamaño de fragmento marca la diferencia entre respuestas precisas y respuestas vagas. Algunos pipelines avanzados combinan búsqueda vectorial con BM25 clásico —lo que se conoce como hybrid search— para mejorar la precisión en corpus con terminología muy específica.

    Paso 2: recuperación semántica y reranking

    Cuando un usuario realiza una consulta, el RAG empresarial convierte la pregunta en una representación vectorial (embedding) y busca en la base de datos los fragmentos más similares. Esta búsqueda es rápida y altamente relevante gracias a algoritmos de similitud vectorial. En implementaciones más avanzadas, un paso de reranking reordena los fragmentos recuperados antes de pasarlos al modelo, mejorando la relevancia de los resultados sin aumentar el coste de la búsqueda inicial.

    La clave aquí es que la búsqueda es semántica, no literal. Si preguntas «¿cuáles son nuestras condiciones de garantía para el sector retail?», el sistema no busca esa frase exacta: entiende el significado y recupera los fragmentos relevantes aunque usen vocabulario diferente. Esto es lo que diferencia la búsqueda inteligente del RAG empresarial de un simple Ctrl+F en tus carpetas.

    Paso 3: generación con contexto verificable

    Con los datos recuperados de la base de conocimiento, el sistema crea un nuevo prompt para el modelo de lenguaje que incluye la consulta original del usuario más el contexto enriquecido. El tamaño de ese contexto —la context window— limita cuántos fragmentos puede procesar el modelo de una vez, lo que hace que el chunking y el reranking sean decisivos. El resultado es una respuesta en lenguaje natural que cita el documento fuente, no una respuesta inventada. En arquitecturas de agentic RAG, el sistema puede además encadenar varias búsquedas de forma autónoma para responder preguntas complejas que requieren cruzar varias fuentes.

    ¿Qué problemas reales resuelve en una pyme?

    El RAG empresarial no es una solución en busca de problema. Existen casos de uso concretos donde el retorno es inmediato y medible.

    • Onboarding de nuevos empleados: los empleados nuevos consultan manuales, reglamentos y procedimientos sin interrumpir a nadie, y el asistente RAG empresarial cita la fuente exacta del documento.
    • Atención al cliente interna: el asistente busca en tu documentación —PDFs, Confluence, SharePoint, Notion— antes de responder. Cualquier agente de soporte tiene la respuesta correcta en segundos.
    • Legal y compliance: la búsqueda semántica sobre contratos y políticas permite obtener la cita exacta del documento y la página; para empresas en proceso de certificación, tener el corpus normativo consultable mediante RAG empresarial acelera auditorías como las de ISO 27001.
    • Gestión del conocimiento comercial: el equipo de ventas puede preguntar «¿qué propuesta enviamos al sector hostelero el año pasado?» y obtener el documento en segundos, listo para adaptar.
    • Desarrollo e IT: runbooks, decisiones de arquitectura, postmortems e historial de incidencias consultables en lenguaje natural. Un knowledge graph bien construido sobre este corpus permite además descubrir dependencias entre sistemas que de otro modo quedarían enterradas en documentos dispersos.

    ¿En qué se diferencia el RAG del fine-tuning?

    Comparación visual: RAG recupera documentos para consultas en tiempo real versus fine-tuning que ajusta el modelo mediante entrenamiento
    RAG es más rápido de implementar y actualizar (los documentos cambian sin reentrenar), mientras que fine-tuning requiere datos etiquetados y reentrenamiento costoso.

    Esta es una de las preguntas más frecuentes cuando una empresa empieza a explorar la IA aplicada a sus documentos internos. La confusión es comprensible, pero la diferencia es decisiva para elegir bien.

    A diferencia del fine-tuning, el RAG empresarial actualiza el conocimiento en tiempo real sin reentrenar modelos. Esto significa que cuando actualizas un procedimiento interno, simplemente subes el nuevo documento al sistema y el RAG lo incorpora de inmediato. Con fine-tuning, necesitarías reentrenar el modelo entero, lo que implica coste, tiempo y conocimientos técnicos avanzados.

    Para la gran mayoría de las pymes, el RAG empresarial es la elección correcta: menor inversión, arranque en semanas y posibilidad de actualizar el conocimiento simplemente subiendo nuevos documentos al sistema. El fine-tuning tiene sentido cuando necesitas que el modelo adopte un estilo muy específico o trabaje con terminología muy especializada, pero para recuperación de información interna, el RAG empresarial gana en casi todos los escenarios.

    Modelos de embedding: la decisión técnica que más afecta al coste y la privacidad

    Elegir el modelo de embedding es tan importante como elegir el LLM, y sin embargo es la decisión que más frecuentemente se toma por defecto. El modelo de embedding determina la calidad de la vectorización, el coste por documento indexado y, de forma crítica, si los datos salen o no de tu infraestructura.

    Modelo de embedding Dimensiones Privacidad / residencia Coste orientativo Mejor para
    OpenAI text-embedding-3-small 1.536 API cloud; residencia UE desde feb. 2025 ~0,02 $ / millón de tokens Pymes que ya usan OpenAI y priorizan facilidad de integración
    OpenAI text-embedding-3-large 3.072 API cloud; residencia UE desde feb. 2025 ~0,13 $ / millón de tokens Corpus extensos donde la precisión semántica es crítica
    Cohere Embed v3 1.024 API cloud; opción de despliegue privado ~0,10 $ / millón de tokens Corpus multilingüe (español incluido) y búsqueda híbrida
    nomic-embed-text 768 Open source; 100% on-premise Coste de cómputo propio (sin licencia) Máxima privacidad; equipos con GPU propia o VPS dedicada
    BGE-M3 (BAAI) 1.024 Open source; 100% on-premise Coste de cómputo propio (sin licencia) Corpus técnicos o legales en español con terminología específica

    La regla práctica es sencilla: si los documentos contienen datos personales, los modelos open source on-premise eliminan el debate sobre transferencias internacionales. Si el corpus es técnico o de producto sin datos sensibles, text-embedding-3-small de OpenAI ofrece una relación calidad-coste difícil de batir. Para corpus en español con terminología jurídica o médica, Cohere Embed v3 y BGE-M3 suelen superar a los modelos de OpenAI en precisión semántica.

    ¿Qué herramientas necesitas para implementar RAG en tu empresa?

    Una implementación de RAG empresarial construida a medida se apoya en tres capas tecnológicas. No necesitas construirlas desde cero: existen soluciones maduras para cada una.

    Base de datos vectorial

    Es donde se almacenan los embeddings de tus documentos. Las opciones más habituales para pymes son Pinecone (SaaS gestionado, sin infraestructura propia), Qdrant (de código abierto, puede desplegarse on-premise para mayor privacidad) y pgvector. Si tu empresa ya usa PostgreSQL, no necesitas contratar una base de datos nueva: instalas la extensión pgvector y listo. Para el 90% de las empresas, esto es suficiente.

    Modelo de lenguaje (LLM)

    Es el componente que genera la respuesta en lenguaje natural a partir del contexto recuperado. GPT y Claude siguen siendo los modelos de referencia para el razonamiento complejo; su precio ha bajado drásticamente respecto a años anteriores. Para empresas con requisitos estrictos de privacidad, los modelos de código abierto como Llama de Meta o Mistral han alcanzado un nivel donde pueden ejecutar RAG empresarial correctamente corriendo en infraestructura propia.

    Framework de orquestación

    LangChain y LlamaIndex son los frameworks más extendidos para conectar todos los componentes del pipeline —indexación, recuperación, reranking, generación— sin tener que programar cada pieza desde cero. Para equipos sin desarrolladores, plataformas como Flowise o n8n permiten construir flujos RAG de forma visual, reduciendo significativamente la barrera técnica.

    ¿Qué stack de RAG empresarial encaja con tu perfil? Árbol de decisión

    Antes de evaluar herramientas, responde estas tres preguntas en orden. Cada bifurcación te lleva a una recomendación concreta y evita que inviertas tiempo analizando opciones que no encajan con tu situación real.

    1. ¿Tienes desarrolladores en el equipo (o presupuesto para contratarlos)?

      • No → Ve directamente a una plataforma SaaS no-code: Guru si necesitas conocimiento verificado por humanos, Vectara si priorizas control de alucinaciones vía API sin código. Ambas tienen conectores para Google Workspace y Microsoft 365.
      • Sí → Pasa a la pregunta 2.
    2. ¿El corpus contiene datos personales (contratos, expedientes, historiales)?

      • Sí → Necesitas arquitectura on-premise o nube privada. Stack recomendado: pgvector + LangChain + Llama/Mistral en tu VPS o servidor propio. Modelo de embedding: nomic-embed-text o BGE-M3. Cero datos salen de tu infraestructura.
      • No → Pasa a la pregunta 3.
    3. ¿El corpus supera los 5.000 documentos o necesitas conectar más de cinco fuentes distintas?

      • Sí → Considera Glean (conectores nativos para +100 apps, herencia de permisos incluida) o un stack propio con Qdrant + LlamaIndex para mayor control.
      • No → Un piloto con pgvector + LangChain + OpenAI text-embedding-3-small + GPT-4o mini es suficiente para validar el concepto. Coste de API: menos de 50 € al mes en fase piloto.

    Plataformas SaaS de RAG: cuándo comprar en lugar de construir

    No todas las pymes tienen capacidad técnica para construir un pipeline RAG desde cero. Para ellas, las plataformas SaaS de RAG son la vía más rápida a producción: conectas tus fuentes de datos, configuras permisos y empiezas a consultar, sin gestionar infraestructura. Comprar tiene sentido cuando el RAG es una capacidad interna para el equipo: los conectores, la herencia de permisos, los registros de auditoría y la integración SSO son componentes no triviales de construir y más difíciles aún de mantener.

    Plataforma Perfil ideal Privacidad / datos UE Facilidad de despliegue Precio orientativo
    Glean Empresas medianas-grandes con muchas apps (Slack, Drive, Jira, Confluence…) Cloud; revisar DPA para RGPD Alta — conectores nativos para +100 apps Presupuesto personalizado (enterprise)
    Guru Equipos que necesitan conocimiento verificado y curado por humanos Cloud; SOC 2; revisar residencia Alta — interfaz no-code, verificación cada 90 días Desde ~10 $/usuario/mes (plan Starter)
    Vectara Equipos técnicos que quieren RAG-as-a-Service vía API con control de alucinaciones Cloud SaaS; revisar DPA Media — requiere integración API Plan gratuito + planes de pago por uso
    Flowise / n8n Pymes con algo de perfil técnico que quieren construir flujos RAG visualmente Self-hosted disponible (máximo control) Media-alta — interfaz visual, sin código Open source; cloud desde ~35 $/mes
    Stack propio (pgvector + LangChain + LLM API) Equipos con desarrolladores que necesitan control total del pipeline On-premise o nube propia Baja — requiere desarrollo Coste de API + tiempo de equipo

    Para equipos que quieren RAG sin gestión de infraestructura, Vectara y Glean son los caminos más rápidos a producción: subes documentos, empiezas a consultar, sin ingeniería de pipeline. Guru, por su parte, exige que los expertos internos revisen y reaprueben las fichas de conocimiento en un ciclo fijo —típicamente cada 90 días—; si una ficha caduca sin verificación, el agente de IA no puede usarla, lo que da lugar a un RAG verificado basado solo en contenido fiable y actualizado. Tanto Guru como Glean tienen conectores nativos para Google Workspace y Microsoft 365, los dos ecosistemas más habituales en pymes españolas, lo que elimina el trabajo de integración manual.

    RGPD y residencia de datos en la UE: la barrera que nadie menciona

    Esquema de cumplimiento RGPD en RAG empresarial: flujo de datos, permisos y residencia en la UE
    El cumplimiento RGPD en un sistema RAG empresarial depende de dónde residen los datos, qué fragmentos se envían al LLM y qué acuerdos de tratamiento existen con los proveedores.

    Para una pyme española, la pregunta sobre privacidad no es opcional: es una barrera de adopción real. Cuando un sistema RAG empresarial procesa documentos que contienen datos personales —contratos con clientes, expedientes de empleados, historiales de soporte—, entra en el ámbito del RGPD y, desde 2024, también del Reglamento de IA de la UE.

    La Agencia Española de Protección de Datos (AEPD) publicó en 2024 su guía sobre el uso de inteligencia artificial y protección de datos, en la que recuerda que cualquier sistema que procese datos personales —incluyendo los fragmentos enviados a un LLM— debe contar con base jurídica, registro de actividades de tratamiento y, si procede, evaluación de impacto (EIPD). La ENISA, por su parte, ha señalado en su informe de amenazas de IA que la exfiltración de datos a través de APIs de terceros es uno de los vectores de riesgo más subestimados en despliegues de IA generativa en empresas europeas.

    En la práctica, hay tres decisiones arquitectónicas que determinan tu nivel de riesgo:

    • On-premise o nube propia: tus documentos nunca salen de tu infraestructura. Es la opción más segura para datos muy sensibles y la que elimina el debate sobre transferencias internacionales. Modelos open source como Llama o Mistral hacen esto viable sin coste de licencia.
    • API de LLM con residencia en la UE: la residencia de datos en la UE para OpenAI llegó para el almacenamiento en reposo en febrero de 2025 y se amplió a la inferencia dentro de la región Europa en enero de 2026, aunque la granularidad es regional, no por país concreto. Microsoft Copilot mantiene los datos dentro de la Frontera de Datos de la UE. En ambos casos, debes firmar un DPA (acuerdo de tratamiento de datos) con el proveedor antes de indexar cualquier documento con datos personales.
    • Plataformas SaaS de RAG: revisa siempre si ofrecen DPA, en qué región residen los datos y si tienen certificaciones como SOC 2 o ISO 27001. Ninguna solución es conforme al RGPD por sí sola; la empresa sigue siendo la responsable del tratamiento según el artículo 24 del Reglamento (UE) 2016/679.

    La recomendación práctica: antes de indexar cualquier documento, clasifica el corpus según si contiene datos personales. Los documentos puramente técnicos o de producto pueden ir a una solución cloud sin mayor problema; los expedientes de empleados o contratos con clientes merecen una arquitectura on-premise o, como mínimo, un proveedor con DPA firmado y residencia verificada en la UE.

    ¿Cómo implementar RAG paso a paso en una pyme?

    La implementación de RAG empresarial en una pyme sigue una secuencia lógica que va de lo más sencillo a lo más complejo. Aquí tienes la hoja de ruta práctica.

    1. Auditoría documental: identifica qué bases de conocimiento existen (Drive, SharePoint, Notion, PDFs locales), en qué estado están y cuáles generan más consultas repetitivas. La calidad del corpus determina la calidad del RAG empresarial.
    2. Definición del caso de uso piloto: elige un único departamento o proceso —por ejemplo, el onboarding de nuevos empleados o las FAQs del equipo de soporte— con documentación relativamente ordenada.
    3. Selección del stack tecnológico: para un piloto de RAG empresarial en pyme, una combinación como pgvector + LangChain + API de OpenAI o Claude es suficiente para validar el concepto sin sobreingeniería. Si no hay equipo técnico, valora una plataforma SaaS como Guru o Vectara.
    4. Indexación y chunking: procesa los documentos, divídelos en fragmentos coherentes y genera los embeddings. Las bases de conocimiento deben actualizarse continuamente para mantener la calidad y relevancia del sistema.
    5. Construcción del pipeline de consulta: configura el flujo completo: recepción de la pregunta → búsqueda semántica (o hybrid search) → reranking → recuperación de fragmentos → generación de respuesta con cita de fuente.
    6. Evaluación y métricas: ver sección específica más abajo.
    7. Despliegue y gobierno: una arquitectura de RAG empresarial debe contemplar seguridad, permisos, trazabilidad y gobierno de datos. Define quién accede a qué documentos y cómo se auditan las consultas.

    Mantenimiento del sistema en producción: el ciclo de vida que nadie explica

    Desplegar el piloto es solo la mitad del trabajo. Un sistema RAG empresarial en producción se degrada si no se mantiene activamente, porque los documentos cambian, los modelos se actualizan y el corpus crece de forma desordenada.

    Estos son los cuatro procesos que debes tener cubiertos desde el primer día:

    • Versionado y reindexación de documentos: cuando un procedimiento interno cambia, el documento antiguo debe marcarse como obsoleto y el nuevo debe reindexarse de inmediato. Si no tienes este proceso automatizado, el sistema empezará a responder con información desactualizada sin que nadie lo note. Herramientas como LlamaIndex permiten configurar reindexación incremental para que solo se procesen los documentos modificados, no el corpus entero.
    • Gestión de obsolescencia: establece una política de caducidad para cada tipo de documento. Un manual de producto puede tener vigencia de seis meses; una política interna de RRHH, de un año. Guru resuelve esto con su ciclo de verificación de 90 días; en stacks propios, necesitas implementarlo tú.
    • Monitorización de la deriva del corpus: cuando el volumen de documentos crece mucho, la distribución semántica del corpus cambia y los embeddings generados hace meses pueden perder precisión. Un muestreo mensual de 20-30 consultas de referencia detecta estas derivas antes de que impacten a los usuarios.
    • Actualización de modelos: cuando el proveedor lanza una nueva versión del modelo de embedding o del LLM, evalúa si merece reindexar el corpus completo. Cambiar de text-embedding-3-small a text-embedding-3-large, por ejemplo, requiere regenerar todos los vectores; el coste es bajo, pero el proceso debe estar planificado.

    Cómo medir si tu RAG empresarial funciona bien: métricas y evaluación

    «El sistema responde» no es suficiente. Un RAG empresarial en producción necesita métricas concretas para detectar degradaciones antes de que los usuarios las noten.

    Las cuatro métricas clave del framework RAGAS

    Imagina que tu sistema RAG es un investigador que busca información para ti. RAGAS mide dos cosas: si el investigador encontró los documentos correctos (recuperación) y si luego te contó fielmente lo que encontró (generación). Si falla en lo primero, la respuesta será incompleta; si falla en lo segundo, la respuesta será inventada aunque los documentos fueran correctos.

    • Faithfulness (fidelidad): mide si cada afirmación de la respuesta está respaldada por los fragmentos recuperados. Piénsalo como el porcentaje de frases de la respuesta que puedes subrayar en los documentos fuente. Un umbral de 0,85 es el estándar habitual en producción; si la media semanal cae más de un 5%, investiga.
    • Context Precision: proporción de fragmentos recuperados que son realmente relevantes para la pregunta. Un valor bajo indica que el reranking o el chunking necesitan ajuste.
    • Context Recall: proporción del conocimiento necesario para responder que el sistema ha conseguido recuperar. Un valor bajo indica que el corpus está incompleto o mal indexado.
    • Answer Relevancy: mide si la respuesta generada es pertinente para la pregunta original, independientemente de si es fiel al contexto.

    Los umbrales de referencia habituales en producción son: faithfulness 0,75, answer relevancy 0,80, context precision 0,70, context recall 0,80. Faithfulness es la métrica que separa un sistema propenso a alucinar de uno fiable: todas las demás existen para mantenerla en niveles aceptables.

    Herramientas de evaluación

    RAGAS proporciona el marco conceptual; DeepEval aporta la integración con CI/CD; Patronus, Langfuse y Lynx cubren huecos específicos en detección de alucinaciones, trazabilidad en producción y evaluación de sesgos. Para equipos que empiezan, RAGAS o DeepEval son la mejor opción para volúmenes de hasta ~2.000 evaluaciones semanales si ya usas Grafana o Datadog.

    La cadencia recomendada: un conjunto de 50-100 preguntas de referencia con respuesta esperada ejecutado en cada cambio del pipeline, más un muestreo del 1% del tráfico real en producción para detectar degradaciones silenciosas por deriva del corpus o del modelo.

    ¿Cuáles son los errores más comunes al implementar RAG?

    Conocer los errores frecuentes antes de empezar ahorra tiempo y dinero. Estos son los que aparecen con más regularidad en proyectos de RAG empresarial.

    • Corpus desordenado o desactualizado: el RAG empresarial amplifica la calidad de tus documentos, no la corrige. Si los manuales tienen tres versiones contradictorias, el sistema devolverá respuestas contradictorias. Antes de indexar, limpia y versiona.
    • Ignorar el chunking: fragmentar mal los documentos es la causa más común de respuestas imprecisas. Un fragmento demasiado pequeño pierde contexto; uno demasiado grande satura la context window del modelo.
    • Descuidar la latencia: el paso de recuperación previo a la generación puede incrementar el tiempo de respuesta; para mitigarlo, optimiza la indexación y el motor de búsqueda, e implementa cachés inteligentes que reduzcan las consultas repetitivas.
    • No definir permisos desde el inicio: en una pyme, no todos los empleados deben acceder a todos los documentos. Diseñar el control de acceso a posteriori es mucho más costoso que incluirlo desde el primer día.
    • No medir: desplegar sin métricas de evaluación (faithfulness, context precision) es apostar a ciegas. Las alucinaciones no desaparecen con RAG: un estudio de Stanford sobre sistemas RAG legales en producción encontró tasas de alucinación no triviales incluso en plataformas comerciales líderes; seguían siendo mejores que un LLM base solo, pero no eran infalibles.
    • Querer abarcarlo todo a la vez: un piloto acotado con métricas claras es más valioso que un despliegue global sin criterios de éxito.

    ¿Cuánto cuesta implementar RAG empresarial en una pyme?

    El coste varía según el alcance, el stack elegido y si se externaliza el desarrollo o se hace internamente. Sin embargo, existen rangos orientativos útiles para planificar.

    Para una pyme o mediana empresa española, un piloto de RAG empresarial en fase inicial tiene un coste de entre 6.000 y 15.000 euros de desarrollo si se externaliza, más los costes de API del modelo de lenguaje, que en esta fase son casi anecdóticos —decenas de euros al mes. A partir de ahí, la escalabilidad depende del volumen de documentos y del número de usuarios concurrentes.

    Para equipos con capacidad técnica interna, el coste del RAG empresarial puede reducirse significativamente usando herramientas de código abierto y modelos locales. La inversión real en ese caso es el tiempo del equipo, no la licencia de software. En cualquier escenario, el retorno se mide en horas recuperadas: si un equipo de diez personas deja de perder dos horas semanales buscando documentos, el ahorro anual supera con creces la inversión del piloto.

    Preguntas frecuentes sobre RAG empresarial

    ¿Necesito un equipo de data science para implementar RAG en mi empresa?

    No necesariamente. Para un piloto básico de RAG empresarial, un desarrollador con conocimientos de Python y familiaridad con APIs puede construir un pipeline RAG funcional usando frameworks como LangChain o LlamaIndex. Para empresas sin equipo técnico propio, existen plataformas no-code como Flowise o soluciones SaaS especializadas como Guru o Vectara que reducen la barrera de entrada. La clave es empezar con un caso de uso acotado y corpus limpio.

    ¿Mis documentos internos estarán seguros si implemento RAG?

    La seguridad depende de la arquitectura elegida. Si optas por una solución on-premise o en tu propia nube privada, tus documentos nunca salen de tu infraestructura. Si usas APIs externas de modelos de lenguaje, los fragmentos de texto se envían al proveedor para generar la respuesta, por lo que debes revisar sus políticas de privacidad, firmar un DPA y verificar la residencia de los datos en la UE. Para información muy sensible, los modelos locales de código abierto son la opción más segura desde el punto de vista del RGPD.

    ¿Qué tipos de documentos puede indexar un sistema RAG?

    Un sistema de RAG empresarial bien configurado puede indexar prácticamente cualquier formato textual: PDFs, documentos Word, páginas de Notion o Confluence, hojas de cálculo, correos electrónicos, transcripciones de reuniones, páginas web internas y bases de datos estructuradas. La condición es que el contenido sea extraíble en texto. Los documentos escaneados sin OCR o las imágenes sin texto alternativo requieren un paso previo de procesamiento.

    ¿Cuánto tiempo tarda en implementarse un piloto RAG?

    Un piloto de RAG empresarial bien acotado —un único departamento, corpus de menos de 500 documentos, un caso de uso definido— puede estar operativo en cuatro a ocho semanas. El tiempo real depende sobre todo del estado de la documentación de partida: si los documentos están ordenados y actualizados, la indexación es rápida; si hay que limpiar y versionar el corpus primero, el plazo se extiende. La fase de evaluación y ajuste posterior suele requerir otras dos o tres semanas adicionales.

    ¿Qué es el hybrid search y cuándo usarlo en RAG?

    El hybrid search combina búsqueda vectorial (semántica) con búsqueda BM25 (léxica clásica) para mejorar la recuperación en corpus con terminología muy específica —nombres de producto, códigos internos, acrónimos— donde la búsqueda puramente semántica puede fallar. Es especialmente útil en entornos legales, técnicos o de compliance donde los términos exactos importan tanto como el significado. La mayoría de los frameworks modernos (LangChain, LlamaIndex, Haystack) lo soportan de forma nativa.

  • SLMs in marketing: practical use cases for SMBs

    SLMs in marketing: practical use cases for SMBs

    SLMs in marketing —Small Language Models— are changing the way SMBs and marketing teams automate communication, analysis, and customer service tasks. Unlike large models such as GPT-4, an SLM runs with far fewer resources, can be deployed locally, and specializes in specific tasks: exactly what a company needs to get real results without relying on costly APIs.

    In this article you will find directly applicable use cases: from lightweight chatbots for customer service to local sentiment analysis on reviews and emails, automated email marketing responses, a cost comparison against LLM APIs, and when to use RAG instead of fine-tuning. Each example includes the minimum technical context so you can assess whether it fits your workflow, as well as the real limitations of this technology so you can make informed decisions.

    What is an SLM and why does it matter in marketing?

    An SLM (Small Language Model) is a language model based on transformer architecture with a significantly lower number of parameters than traditional LLMs: from a few million up to around 7 billion. GPT-4 works with hundreds of billions of parameters; an SLM like Phi-4 Mini or LLaMA 3.2 3B operates with a fraction of that. The value of SLMs in marketing lies precisely in that efficiency: they allow you to automate tasks that LLMs would handle at a disproportionate cost.

    They are designed to run efficiently on limited hardware, making them practical for deployment on local devices and cost-sensitive business applications. They sacrifice some generality compared to frontier LLMs, but gain in speed, cost, privacy, and deployability. For an SMB or a marketing team with a tight budget, that equation is very attractive.

    While LLMs aim to offer generalist capabilities, small language models prioritize efficiency and specialization. In practice, this translates into customer service automation, local sentiment analysis, and content generation without sending data to external servers.

    Why are SLMs a real option for SMBs?

    The barrier to entry for generative AI has always been cost: infrastructure, API licenses, and third-party dependency. Lightweight models for SMBs break down that barrier in three concrete ways.

    Reduced cost without sacrificing utility

    Small language models require less infrastructure, minimizing investment in hardware and energy consumption. A modest server or even an office computer with a decent GPU can run a 3–7B parameter SLM without any problem.

    Moreover, by not depending on paid external API calls, the cost is predictable and does not scale with query volume. No surprises on the bill at the end of the month. This fixed-cost structure is especially cost-effective for companies with a high volume of repetitive interactions.

    Privacy and regulatory compliance

    This point is critical for any company that handles customer data. Since SLMs can be deployed in local environments or private cloud, they offer enhanced security and privacy, as sensitive information remains under the organization’s control.

    Local deployment ensures that all data processing happens on your own hardware. No data leaves your network, which automatically satisfies GDPR requirements and other business compliance regulations. For marketing teams that process customer data, this is not a luxury: it is a legal requirement.

    Beyond GDPR, two additional considerations are worth keeping in mind: if you use customer data to train or fine-tune the model, you must ensure that your privacy policy covers this and that the data has been properly anonymized. And if the chatbot or automated system interacts with end users, best practice —and in some contexts an emerging regulatory obligation— is to inform the user that they are talking to an AI system, not a person.

    Specialization that improves accuracy

    Although less versatile than monolithic giant LLMs, small language models can outperform their larger counterparts on specific tasks thanks to their focused training and lower contextual “noise.” An SLM fine-tuned with your company’s FAQs or your brand’s tone of voice will respond better than a generalist model that does not know your business. This specialization capability is one of the strongest arguments in favor of this technology over generalist solutions.

    Local SLM vs. LLM API: a real cost comparison

    The cost argument is the most straightforward for the investment decision, but it is rarely quantified. The table below compares the approximate costs of processing 1 million tokens per month with a paid LLM API versus deploying an SLM locally, at an equivalent query volume.

    Local SLM vs. LLM API: estimated monthly costs (1M tokens/month)
    Item GPT-4o API (OpenAI) Local SLM (Mistral 7B / Phi-4 Mini)
    Cost per 1M input tokens ~$2.50 (input) + ~$10 (output) $0 (zero marginal cost per token)
    Monthly infrastructure $0 (managed API) ~€50–150/month (GPU VPS or amortized own server)
    Estimated cost at 1M tokens/month ~$12.50/month ~€50–150/month (fixed, regardless of volume)
    Estimated cost at 10M tokens/month ~$125/month ~€50–150/month (unchanged)
    Data privacy Data sent to OpenAI Data on your local network
    Break-even point The local SLM amortizes infrastructure from ~5–10M tokens/month, or sooner if privacy is a priority

    The practical takeaway is this: at low volumes, the LLM API may be cheaper because it eliminates the fixed infrastructure cost. But as soon as query volume exceeds 5–10 million tokens per month —or when data privacy is non-negotiable— the local SLM becomes clearly more cost-effective. For an SMB with 300 daily customer service interactions (each around ~500 tokens), that is approximately 4.5 million tokens per month: the break-even point is reached quickly.

    When is an SLM not enough? Real limitations

    Being honest about the limits of a technology is the best way to use it well. Small language models have clear advantages, but there are also scenarios where a larger-scale LLM is the right choice.

    Complex multi-step reasoning

    SLMs struggle with tasks that require chaining several reasoning steps, cross-referencing sources, or maintaining coherence in very long contexts. For multifaceted tasks or complex data patterns, SLMs may not match the accuracy of larger models. If your use case involves strategic analysis, synthesis of complex reports, or decision-making with multiple variables, a larger-scale LLM —or an agent with access to external tools— will be more reliable.

    Advanced multilingualism

    The performance of small models in languages other than English drops noticeably when it comes to cross-lingual reasoning or understanding cultural nuances. Direct distillation from a large model to a 3B-parameter one fails to reproduce effective reasoning across multiple languages. If your company operates in markets with very different languages or low-resource languages, evaluate the model carefully before deploying it in production.

    Open-ended creativity and unconstrained generation

    SLMs perform well when the domain is bounded. For open-ended creative writing tasks —branding campaigns with a high conceptual component, high emotional-impact copy, complex brand storytelling— the lower generalization capacity shows. The sweet spot for lightweight models is the repetitive, well-defined task, not creation from scratch without constraints.

    How do chatbots with SLMs work in customer service?

    Chatbots with SLMs are the most immediate use case for customer service automation. The idea is simple: you train or fine-tune a lightweight model with your company’s knowledge base —frequently asked questions, return policies, product catalog— and deploy it as an assistant on your website, WhatsApp Business, or ticketing system.

    Practical example: e-commerce store

    Imagine an online fashion store with a volume of 200–300 daily inquiries. Most are repetitive: order status, exchange policy, available sizes. An SLM fine-tuned with that data can resolve 70–80% of those inquiries without human intervention, escalating to an agent only the cases that require judgment or authorization. This is one of the use cases with the highest immediate return for e-commerce.

    The model runs locally, customer data does not leave the company’s server, and response time is under one second. The customer service team is freed up to handle real incidents, complex complaints, and upselling opportunities. Key metrics to monitor: resolution rate without escalation (target: >70%), average first response time (target: <2 seconds), and CSAT (customer satisfaction) for bot-handled conversations.

    Practical example: B2B services company

    In a B2B context, the SLM-powered chatbot can act as a first lead qualification filter. The model collects information from the visitor —industry, company size, specific need— classifies it according to predefined criteria, and schedules a meeting or routes to the appropriate sales rep based on the score obtained. All of this without the sales team intervening until the lead is qualified. This solution integrates directly into marketing automation and demand generation workflows.

    What is local sentiment analysis and how is it applied?

    Local sentiment analysis with three customer messages classified by emotion: positive, negative, and neutral.
    Local sentiment analysis processes customer opinions in real time without sending data to external servers, improving privacy and response speed.

    Local sentiment analysis consists of running an emotional classification model directly on your own infrastructure, without sending texts to an external API. The key advantage is that you can process large volumes of text —reviews, emails, social media mentions— at no per-call cost and with full control over the data.

    Practical example: analysis of Google and Trustpilot reviews

    A restaurant chain or a business with multiple points of sale receives dozens of reviews weekly across different platforms. An SLM configured for sentiment analysis can automatically classify each review (positive, negative, neutral) and identify recurring themes: waiting time, product quality, staff attitude. This technology makes it possible to detect trends before they become reputation crises.

    The marketing team gets a weekly dashboard with sentiment trends by location, without manually reviewing every comment. This allows quick action when a location starts receiving criticism about a specific aspect. Key metric: percentage of negative reviews detected and responded to within 24 hours (target: >90%).

    Practical example: email prioritization in customer service

    An SLM can analyze the emotional tone of incoming emails and automatically prioritize urgent messages or those with a negative emotional charge. A customer who writes with evident frustration receives a response before a routine informational inquiry. Research in automated sentiment analysis has documented reductions in processing time from 4 hours to 8 minutes in high-ticket-volume customer service environments. This operational improvement is quantifiable from the first day of deployment.

    How to automate email marketing with lightweight models?

    Customer service automation via email is another area where small language models offer an immediate return. Beyond classic autoresponders, this technology can generate personalized responses, classify emails by intent, and adapt tone according to the customer’s context.

    Automatic classification and routing

    The first step is classification: the SLM reads the incoming email and labels it according to the detected intent —price inquiry, technical support request, complaint, commercial information request. Each category is routed to the corresponding team or template. The result is an organized inbox where every message reaches the right person in seconds, without anyone having to manually read and redirect it. Recommended tracking metric: correct routing rate (target: >95% after the first few weeks of adjustment).

    Personalized draft generation

    Once the email is classified, the SLM can generate a draft response based on the corresponding template and the customer data available in the CRM. The human agent reviews it, adjusts if necessary, and sends. This workflow drastically reduces drafting time without eliminating human oversight, which remains necessary for the most sensitive cases.

    How to integrate an SLM with your current marketing stack?

    One of the most common obstacles to implementing this technology is not technical: it is uncertainty about how to connect the model with the tools you already use. The integration pattern is always the same, regardless of the platform.

    Basic integration architecture

    The SLM acts as a microservice with its own REST API (exposed, for example, with Ollama or with FastAPI on top of Hugging Face Transformers). From there, any tool that supports webhooks or HTTP integrations can connect without friction:

    • HubSpot: use HubSpot workflows to trigger an HTTP call to the SLM when a lead arrives or a contact is updated. The model classifies the intent or generates an email draft, and the result is written back to the contact’s notes field via the HubSpot API.
    • Zendesk: through Zendesk’s native triggers and webhooks, the SLM receives the ticket text, analyzes the sentiment, and updates the ticket priority or suggests a response in the internal comment field before the agent sees it.
    • WhatsApp Business API: the SLM sits between Meta’s webhook and your CRM. Each incoming message passes through the model, which decides whether to respond automatically (frequent inquiry) or escalate to the agent (complex case), logging the conversation in HubSpot or Zendesk in real time.
    • Mailchimp / email platforms: the SLM processes segmentation data from the CRM and generates subject lines or personalized copy variants by segment, which are inserted into templates via API before sending.

    This pattern —SLM as microservice + webhooks from the existing stack— allows you to deploy the solution without replacing any current tool. The model joins the workflow, it does not replace it. If you want to go deeper into how to structure these flows, the article on marketing automation with AI covers the integration architecture in more detail.

    What other use cases do SLMs have in content marketing?

    Beyond customer service, small models have direct application in content generation and optimization.

    Product descriptions at scale

    For stores with catalogs of hundreds or thousands of items, an SLM fine-tuned with the brand’s tone can generate consistent, SEO-optimized product descriptions from a basic spec sheet. The editorial team reviews a sample and approves in bulk, instead of writing each description from scratch. SLMs in e-commerce marketing allow product content production to scale without increasing the writing team.

    Report summaries and briefings

    For a marketing team that handles campaign reports, competitive analysis, or market studies, a lightweight model can condense lengthy documents into executive summaries in seconds, ready to present in meetings or include in internal newsletters.

    Which SLM models can you use right now?

    Comparison of available SLM models with speed, size, and use case indicators for SMBs.
    Models like Phi and Mistral offer capabilities close to GPT at a fraction of the size, running locally on standard SMB servers.

    The ecosystem of lightweight models for SMBs has matured considerably. These are the most relevant ones for marketing and customer service use cases:

    SLM comparison for marketing and customer service
    Model Parameters Strength Ideal for
    Phi-4 Mini 3.8B Reasoning and accuracy on bounded tasks Intent classification, FAQ
    LLaMA 3.2 (3B) 3B Edge and mobile deployment Lightweight chatbots, sentiment analysis
    Gemma 2 (9B) 9B Performance comparable to previous 70B models Content generation, summaries
    Mistral 7B 7B Speed/quality balance for text Email automation, customer service

    Among the most active families at present are SmolLM, Qwen, Gemma, Phi, and LLaMA. All are available as open models and can be run locally with tools such as Ollama or LM Studio, without requiring advanced MLOps knowledge. You can check the updated comparative performance on the Open LLM Leaderboard by Hugging Face.

    Fine-tuning vs. RAG: which to choose based on your data

    When the time comes to specialize an SLM for your business, the first question is: do I have enough data to fine-tune? If the answer is no —or if your knowledge base changes frequently— RAG (Retrieval-Augmented Generation) is the industry-standard alternative, and in many cases the most pragmatic one for SMBs.

    When to use RAG instead of fine-tuning

    RAG combines the SLM with a document retrieval system: instead of “memorizing” knowledge during training, the model queries a document base in real time (PDFs, web pages, FAQs, CRM articles) and generates the response based on the retrieved fragments. The practical threshold is clear: if you have fewer than 200 historical question/answer pairs, RAG is more reliable than fine-tuning.

    The advantages of RAG for SMBs are three: you do not need labeled data in large quantities, the knowledge base is updated without retraining the model (you just add documents to the index), and responses are traceable —you can see which fragment the model used to answer, making it easier to detect errors. The most accessible implementation combines a local SLM (Mistral 7B or LLaMA 3.2) with an embeddings system such as ChromaDB or Weaviate and an orchestrator like LangChain or LlamaIndex.

    When fine-tuning is still the best option

    Fine-tuning makes sense when you need the model to adopt a very specific tone of voice, when responses must follow a precise structured format (for example, JSON responses for integrations), or when you have more than 500 high-quality examples and the domain is stable. In those cases, a fine-tuned model consistently outperforms RAG in inference speed and format consistency.

    How to fine-tune an SLM with your own data?

    Fine-tuning turns a generic model into a useful tool for your business. With current tools, the process is within reach of any developer with basic Python knowledge, without the need for specialized hardware or a data science team.

    The most accessible combination for SMBs is Unsloth with LoRA adapters (Low-Rank Adaptation). Unsloth reduces VRAM requirements and training time by half; LoRA can match the performance of full fine-tuning using 4 times less VRAM. This means you can fine-tune a 3–7B parameter model on a consumer GPU (16 GB VRAM) or on Google Colab for free. Unsloth supports fine-tuning for Llama 4, Gemma 3, Phi 4, Mistral, and Qwen 2.5.

    Step-by-step workflow

    1. Prepare the dataset. You will need at least 500–1000 query/response pairs exported from your CRM or ticketing system. If you do not reach that volume, consider RAG (see previous section). Quality is more important than quantity: remove outdated, toxic, or ambiguous examples.
    2. Choose the base model and load with 4-bit quantization. For classification or short-answer tasks, Phi-4 Mini or LLaMA 3.2 3B are good options. It is recommended to start with QLoRA, one of the most accessible and effective methods for training models on limited hardware.
    3. Configure the key hyperparameters. Between 1 and 3 training epochs; more than 3 increases the risk of overfitting. The most common LoRA rank range is between 16 and 64. For SLMs with LoRA, the learning rate is the most influential hyperparameter; a safe starting point is 2e-4.
    4. Train and evaluate. With a dataset of 500–1000 examples and a 3B parameter model, training typically completes in 30–90 minutes on a Colab T4 GPU. Monitor the validation loss: if it starts rising while the training loss falls, there is overfitting.
    5. Validate quality in production. Validation loss measures technical fit, but not whether the model is useful in the real world. Use these complementary metrics: F1-score for classification tasks (intent, sentiment); human evaluation by sampling —manually review a 5–10% sample of generated responses each week; and hallucination rate, meaning responses the model invents without basis in the context. To detect hallucinations, compare the model’s responses with the source documents or with the historical responses of the human team. If the model answers questions outside its domain with confidence, add a guardrails layer (intent filters) before inference. Retrain when the escalation rate to the human agent exceeds the defined threshold or when the business incorporates new products, policies, or services.
    6. Deploy with Ollama. Export the fine-tuned model in GGUF format and load it into Ollama to expose it as a local API. From there, connect with your marketing stack as described in the integration section.

    How to start implementing SLMs in your company?

    Implementing small language models in marketing does not require a data science team or complex infrastructure. The most direct path for an SMB goes through three phases.

    1. Define the most bounded use case possible. Do not start with “automate all customer service.” Start with “automatically answer the 15 most frequent questions about shipping.” The more specific, the better the model will work.
    2. Choose the model and deployment tool. For most SMBs, Ollama + a 3–7B parameter model is enough to get started. You do not need a high-performance GPU for classification tasks or short answers.
    3. Decide between fine-tuning and RAG based on your data. If you have more than 500 historical pairs and a stable domain, fine-tuning with LoRA is the most powerful option. If you do not reach that volume or your knowledge base changes frequently, RAG will give you faster and more maintainable results.

    The key is not to try to solve everything at once: a well-tuned SLM for a specific task delivers more value than a poorly configured generalist model for ten. Progressive implementation is the strategy that generates the fastest and most sustainable results.

    Frequently asked questions about SLMs in marketing

    What is the difference between an SLM and an LLM for use in marketing?

    An LLM (Large Language Model) like GPT-4 has hundreds of billions of parameters, is generalist, and requires costly infrastructure or paid APIs. An SLM has between 1B and 7B parameters, specializes in specific tasks, and can run on standard hardware. For marketing and customer service, where tasks are repetitive and bounded, a well-tuned SLM is usually more efficient and economical than a generalist LLM. SLMs in marketing thus offer a cost-performance ratio that is hard to match for SMBs.

    Can chatbots with SLMs completely replace human agents?

    Not completely, nor is that the goal. Chatbots with SLMs are most effective as a first filter: they resolve frequent inquiries, classify intents, and route complex cases to the appropriate agent. Customer service automation with SLMs frees people up for interactions that genuinely require judgment, empathy, or authorization. SLMs in customer service marketing are a support tool, not a replacement.

    Is it complicated to deploy an SLM for local sentiment analysis?

    With current tools like Ollama or Hugging Face Transformers, basic deployment is within reach of any junior developer or technician with Python knowledge. Local sentiment analysis with models like LLaMA 3.2 or Mistral 7B can be set up in a few hours. The most important work is preparing the training data or few-shot examples so the model classifies correctly in your specific context. SLMs in sentiment analysis marketing are, in this sense, one of the most accessible applications to start with.

    What budget does an SMB need to implement lightweight models?

    The infrastructure cost can be minimal: many 3–7B parameter SLMs run on a server with 16 GB of RAM or on a consumer GPU. The real cost lies in configuration and fine-tuning time. Unlike paid LLM APIs, there is no per-query cost, which makes the return on investment especially attractive for companies with a high volume of repetitive interactions. This fixed-cost structure is one of the strongest arguments in favor of SLMs in marketing compared to API-based alternatives.

  • SLMs en marketing: casos de uso prácticos para pymes

    SLMs en marketing: casos de uso prácticos para pymes

    Los SLMs en marketing —modelos de lenguaje pequeños (Small Language Models)— están cambiando la forma en que las pymes y los equipos de marketing automatizan tareas de comunicación, análisis y atención al cliente. A diferencia de los grandes modelos como GPT-4, un SLM se ejecuta con muchos menos recursos, puede desplegarse en local y se especializa en tareas concretas: exactamente lo que necesita una empresa que quiere resultados reales sin depender de APIs costosas.

    En este artículo encontrarás casos de uso directamente aplicables: desde chatbots ligeros para atención al cliente hasta análisis de sentimiento local en reseñas y correos, pasando por la automatización de respuestas en email marketing, la comparativa de costes frente a APIs de LLM y cuándo usar RAG en lugar de fine-tuning. Cada ejemplo incluye el contexto técnico mínimo para que puedas evaluar si encaja en tu flujo de trabajo, y también los límites reales de esta tecnología para que tomes decisiones informadas.

    ¿Qué es un SLM y por qué importa en marketing?

    Un SLM (Small Language Model) es un modelo de lenguaje basado en arquitectura transformer con un número significativamente menor de parámetros que los LLM tradicionales: desde unos pocos millones hasta alrededor de 7.000 millones. GPT-4 trabaja con cientos de miles de millones de parámetros; un SLM como Phi-4 Mini o LLaMA 3.2 de 3B opera con una fracción de eso. El valor de los SLMs en marketing reside precisamente en esa eficiencia: permiten automatizar tareas que los LLM resolverían con un coste desproporcionado.

    Están diseñados para ejecutarse de forma eficiente en hardware limitado, lo que los hace prácticos para el despliegue en dispositivos locales y aplicaciones empresariales sensibles al coste. Sacrifican algo de generalidad frente a los LLM de frontera, pero ganan en velocidad, coste, privacidad y capacidad de despliegue. Para una pyme o un equipo de marketing con presupuesto ajustado, esa ecuación es muy atractiva.

    Mientras que los LLM buscan ofrecer capacidades generalistas, los modelos de lenguaje pequeños priorizan la eficiencia y la especialización. En la práctica, esto se traduce en automatización de atención al cliente, análisis de sentimiento local y generación de contenido sin enviar datos a servidores externos.

    ¿Por qué los SLMs son una opción real para pymes?

    La barrera de entrada a la IA generativa siempre ha sido el coste: infraestructura, licencias de API y dependencia de terceros. Los modelos ligeros para pymes rompen esa barrera de tres formas concretas.

    Coste reducido sin sacrificar utilidad

    Los modelos de lenguaje pequeños requieren menos infraestructura, lo que minimiza la inversión en hardware y consumo energético. Un servidor modesto o incluso un ordenador de oficina con buena GPU puede ejecutar un SLM de 3-7B parámetros sin problema.

    Además, al no depender de llamadas a APIs externas de pago, el coste es predecible y no escala con el volumen de consultas. No hay sorpresas en la factura a final de mes. Esta estructura de costes fijos es especialmente rentable para empresas con alto volumen de interacciones repetitivas.

    Privacidad y cumplimiento normativo

    Este punto es crítico para cualquier empresa que maneje datos de clientes. Dado que los SLMs pueden desplegarse en entornos locales o en nube privada, ofrecen seguridad y privacidad mejoradas, ya que la información sensible permanece bajo el control de la organización.

    El despliegue local garantiza que todo el procesamiento de datos ocurre en tu propio hardware. Ningún dato sale de tu red, lo que satisface automáticamente los requisitos de GDPR y otras normativas de cumplimiento empresarial. Para equipos de marketing que procesan datos de clientes, esto no es un lujo: es un requisito legal.

    Más allá del GDPR, conviene tener en cuenta dos consideraciones adicionales: si usas datos de clientes para entrenar o afinar el modelo, debes asegurarte de que tu política de privacidad lo contempla y de que los datos han sido anonimizados correctamente. Y si el chatbot o el sistema automatizado interactúa con usuarios finales, la buena práctica —y en algunos contextos una obligación regulatoria emergente— es informar al usuario de que está hablando con un sistema de IA, no con una persona.

    Especialización que mejora la precisión

    Aunque menos versátiles que los LLM monolíticos gigantes, los modelos de lenguaje pequeños pueden superar a sus contrapartes más grandes en tareas específicas gracias a su entrenamiento enfocado y su menor «ruido» contextual. Un SLM afinado con las FAQs de tu empresa o con el tono de voz de tu marca responderá mejor que un modelo generalista que no conoce tu negocio. Esta capacidad de especialización es uno de los argumentos más sólidos a favor de esta tecnología frente a soluciones generalistas.

    SLM local vs. API de LLM: comparativa de costes reales

    El argumento del coste es el más directo para la decisión de inversión, pero raramente se cuantifica. La tabla siguiente compara los costes aproximados de procesar 1 millón de tokens al mes con una API de LLM de pago frente a desplegar un SLM en local, a volumen equivalente de consultas.

    SLM local vs. API de LLM: estimación de costes mensuales (1M tokens/mes)
    Concepto API GPT-4o (OpenAI) SLM local (Mistral 7B / Phi-4 Mini)
    Coste por 1M tokens de entrada ~2,50 $ (input) + ~10 $ (output) 0 $ (coste marginal por token)
    Infraestructura mensual 0 $ (API gestionada) ~50-150 €/mes (VPS con GPU o servidor propio amortizado)
    Coste estimado a 1M tokens/mes ~12,50 $/mes ~50-150 €/mes (fijo, independiente del volumen)
    Coste estimado a 10M tokens/mes ~125 $/mes ~50-150 €/mes (sin cambios)
    Privacidad de datos Datos enviados a OpenAI Datos en tu red local
    Punto de equilibrio El SLM local amortiza la infraestructura a partir de ~5-10M tokens/mes, o antes si la privacidad es prioritaria

    La lectura práctica es esta: a volúmenes bajos, la API de LLM puede ser más barata porque elimina el coste fijo de infraestructura. Pero en cuanto el volumen de consultas supera los 5-10 millones de tokens mensuales —o cuando la privacidad de los datos es innegociable—, el SLM local se vuelve claramente más rentable. Para una pyme con 300 interacciones diarias de atención al cliente (cada una de ~500 tokens), hablamos de aproximadamente 4,5 millones de tokens al mes: el punto de equilibrio se alcanza con rapidez.

    ¿Cuándo un SLM no es suficiente? Limitaciones reales

    Ser honesto sobre los límites de una tecnología es la mejor forma de usarla bien. Los modelos de lenguaje pequeños tienen ventajas claras, pero también escenarios donde un LLM de mayor escala es la elección correcta.

    Razonamiento complejo en múltiples pasos

    Los SLMs tienen dificultades con tareas que requieren encadenar varios pasos de razonamiento, contrastar fuentes o mantener coherencia en contextos muy largos. Para tareas multifacéticas o patrones de datos complejos, los SLMs podrían no igualar la precisión de modelos más grandes. Si tu caso de uso implica análisis estratégico, síntesis de informes complejos o toma de decisiones con múltiples variables, un LLM de mayor escala —o un agente con acceso a herramientas externas— será más fiable.

    Multilingüismo avanzado

    El rendimiento de los modelos pequeños en idiomas distintos al inglés cae de forma notable cuando se trata de razonamiento cruzado o comprensión de matices culturales. La destilación directa de un modelo grande a uno de 3B parámetros no logra reproducir un razonamiento efectivo en múltiples idiomas. Si tu empresa opera en mercados con idiomas muy distintos entre sí o con lenguas de bajos recursos, evalúa bien el modelo antes de desplegarlo en producción.

    Creatividad abierta y generación sin restricciones

    Los SLMs rinden bien cuando el dominio está acotado. En cambio, para tareas de escritura creativa abierta —campañas de branding con alto componente conceptual, copy de alto impacto emocional, storytelling de marca complejo— la menor capacidad de generalización se nota. El sweet spot de los modelos ligeros es la tarea repetitiva y bien definida, no la creación desde cero sin restricciones.

    ¿Cómo funcionan los chatbots con SLMs en atención al cliente?

    Los chatbots con SLMs son el caso de uso más inmediato para la automatización de atención al cliente. La idea es sencilla: entrenas o afinas un modelo ligero con la base de conocimiento de tu empresa —preguntas frecuentes, políticas de devolución, catálogo de productos— y lo despliegas como asistente en tu web, WhatsApp Business o sistema de tickets.

    Ejemplo práctico: tienda de ecommerce

    Imagina una tienda online de moda con un volumen de 200-300 consultas diarias. La mayoría son repetitivas: estado del pedido, política de cambios, tallas disponibles. Un SLM afinado con esos datos puede resolver el 70-80% de esas consultas sin intervención humana, derivando al agente solo los casos que requieren criterio o autorización. Este es uno de los casos de uso con mayor retorno inmediato para el comercio electrónico.

    El modelo se ejecuta en local, los datos del cliente no salen del servidor de la empresa y el tiempo de respuesta es inferior a un segundo. El equipo de atención al cliente se libera para gestionar incidencias reales, reclamaciones complejas y oportunidades de upselling. Métricas de referencia a monitorizar: tasa de resolución sin escalado (objetivo: >70%), tiempo medio de primera respuesta (objetivo: <2 segundos) y CSAT (satisfacción del cliente) en conversaciones gestionadas por el bot.

    Ejemplo práctico: empresa de servicios B2B

    En un contexto B2B, el chatbot con SLM puede actuar como primer filtro de cualificación de leads. El modelo recoge información del visitante —sector, tamaño de empresa, necesidad concreta—, la clasifica según criterios predefinidos y agenda una reunión o deriva al comercial adecuado según la puntuación obtenida. Todo ello sin que el equipo de ventas intervenga hasta que el lead está cualificado. Esta solución se integra directamente en los flujos de automatización de marketing y generación de demanda.

    ¿Qué es el análisis de sentimiento local y cómo se aplica?

    Análisis de sentimiento local con tres mensajes de clientes clasificados por emoción: positivo, negativo y neutral.
    El análisis de sentimiento local procesa opiniones de clientes en tiempo real sin enviar datos a servidores externos, mejorando privacidad y velocidad de respuesta.

    El análisis de sentimiento local consiste en ejecutar un modelo de clasificación emocional directamente en tu infraestructura, sin enviar los textos a una API externa. La ventaja clave es que puedes procesar grandes volúmenes de texto —reseñas, correos, menciones en redes— sin coste por llamada y con total control sobre los datos.

    Ejemplo práctico: análisis de reseñas de Google y Trustpilot

    Una cadena de restaurantes o un negocio con múltiples puntos de venta recibe decenas de reseñas semanales en distintas plataformas. Un SLM configurado para análisis de sentimiento puede clasificar automáticamente cada reseña (positiva, negativa, neutra) e identificar los temas recurrentes: tiempo de espera, calidad del producto, trato del personal. Esta tecnología permite detectar tendencias antes de que se conviertan en crisis de reputación.

    El equipo de marketing obtiene un dashboard semanal con las tendencias de sentimiento por ubicación, sin revisar manualmente cada comentario. Eso permite actuar con rapidez cuando un local empieza a recibir críticas sobre un aspecto concreto. Métrica clave: porcentaje de reseñas negativas detectadas y respondidas en menos de 24 horas (objetivo: >90%).

    Ejemplo práctico: priorización de correos en atención al cliente

    Un SLM puede analizar el tono emocional de los correos entrantes y priorizar automáticamente los mensajes urgentes o con carga emocional negativa. Un cliente que escribe con frustración evidente recibe respuesta antes que una consulta informativa rutinaria. La investigación en análisis de sentimiento automatizado ha documentado reducciones del tiempo de procesamiento de 4 horas a 8 minutos en entornos de atención al cliente con alto volumen de tickets. Esta mejora operativa es cuantificable desde el primer día de despliegue.

    ¿Cómo automatizar el email marketing con modelos ligeros?

    La automatización de atención al cliente vía email es otro campo donde los modelos de lenguaje pequeños ofrecen un retorno inmediato. Más allá de los autoresponders clásicos, esta tecnología puede generar respuestas personalizadas, clasificar correos por intención y adaptar el tono según el contexto del cliente.

    Clasificación y enrutamiento automático

    El primer paso es la clasificación: el SLM lee el correo entrante y lo etiqueta según la intención detectada —consulta de precio, solicitud de soporte técnico, reclamación, petición de información comercial—. Cada categoría se enruta al equipo o plantilla correspondiente. El resultado es una bandeja de entrada ordenada donde cada mensaje llega al responsable correcto en segundos, sin que nadie tenga que leer y redirigir manualmente. Métrica de seguimiento recomendada: tasa de enrutamiento correcto (objetivo: >95% tras las primeras semanas de ajuste).

    Generación de borradores personalizados

    Una vez clasificado el correo, el SLM puede generar un borrador de respuesta basado en la plantilla correspondiente y los datos del cliente disponibles en el CRM. El agente humano revisa, ajusta si es necesario y envía. Este flujo reduce drásticamente el tiempo de redacción sin eliminar la supervisión humana, que sigue siendo necesaria para los casos más delicados.

    ¿Cómo integrar un SLM con tu stack de marketing actual?

    Uno de los frenos más habituales al implementar esta tecnología no es técnico: es la incertidumbre sobre cómo conectar el modelo con las herramientas que ya usas. El patrón de integración es siempre el mismo, independientemente de la plataforma.

    Arquitectura básica de integración

    El SLM actúa como un microservicio con una API REST propia (expuesta, por ejemplo, con Ollama o con FastAPI sobre Hugging Face Transformers). Desde ahí, cualquier herramienta que soporte webhooks o integraciones HTTP puede conectarse sin fricciones:

    • HubSpot: usa los workflows de HubSpot para disparar una llamada HTTP al SLM cuando llega un lead o se actualiza un contacto. El modelo clasifica la intención o genera un borrador de email, y el resultado se escribe de vuelta en el campo de notas del contacto vía API de HubSpot.
    • Zendesk: a través de los triggers y webhooks nativos de Zendesk, el SLM recibe el texto del ticket, analiza el sentimiento y actualiza la prioridad del ticket o sugiere una respuesta en el campo de comentario interno antes de que el agente lo vea.
    • WhatsApp Business API: el SLM se sitúa entre el webhook de Meta y tu CRM. Cada mensaje entrante pasa por el modelo, que decide si responde automáticamente (consulta frecuente) o escala al agente (caso complejo), registrando la conversación en HubSpot o Zendesk en tiempo real.
    • Mailchimp / plataformas de email: el SLM procesa los datos de segmentación del CRM y genera líneas de asunto o variantes de copy personalizadas por segmento, que se insertan en las plantillas vía API antes del envío.

    Este patrón —SLM como microservicio + webhooks del stack existente— permite desplegar la solución sin reemplazar ninguna herramienta actual. El modelo se suma al flujo, no lo sustituye. Si quieres profundizar en cómo estructurar estos flujos, el artículo sobre automatización de marketing con IA cubre la arquitectura de integraciones con más detalle.

    ¿Qué otros casos de uso tienen los SLMs en marketing de contenidos?

    Más allá de la atención al cliente, los modelos pequeños tienen aplicación directa en la generación y optimización de contenido.

    Descripciones de producto a escala

    Para tiendas con catálogos de cientos o miles de referencias, un SLM afinado con el tono de marca puede generar descripciones de producto consistentes y optimizadas para SEO a partir de una ficha técnica básica. El equipo editorial revisa una muestra y aprueba en bloque, en lugar de redactar cada descripción desde cero. Los SLMs en marketing de ecommerce permiten escalar la producción de contenido de producto sin incrementar el equipo de redacción.

    Resúmenes de informes y briefings

    Para un equipo de marketing que maneja informes de campaña, análisis de competencia o estudios de mercado, un modelo ligero puede condensar documentos extensos en resúmenes ejecutivos en segundos, listos para presentar en reuniones o incluir en newsletters internas.

    ¿Qué modelos SLM puedes usar hoy mismo?

    Comparativa de modelos SLM disponibles con indicadores de velocidad, tamaño y casos de uso para pymes.
    Modelos como Phi y Mistral ofrecen capacidades cercanas a GPT con una fracción del tamaño, ejecutándose localmente en servidores estándar de pymes.

    El ecosistema de modelos ligeros para pymes ha madurado considerablemente. Estos son los más relevantes para casos de uso en marketing y atención al cliente:

    Comparativa de SLMs para marketing y atención al cliente
    Modelo Parámetros Punto fuerte Ideal para
    Phi-4 Mini 3,8B Razonamiento y precisión en tareas acotadas Clasificación de intenciones, FAQ
    LLaMA 3.2 (3B) 3B Despliegue en edge y móvil Chatbots ligeros, análisis de sentimiento
    Gemma 2 (9B) 9B Rendimiento comparable a modelos 70B anteriores Generación de contenido, resúmenes
    Mistral 7B 7B Equilibrio velocidad/calidad en texto Email automation, atención al cliente

    Entre las familias más activas en la actualidad se encuentran SmolLM, Qwen, Gemma, Phi y LLaMA. Todos están disponibles en abierto y pueden ejecutarse localmente con herramientas como Ollama o LM Studio, sin necesidad de conocimientos avanzados de MLOps. Puedes consultar el rendimiento comparativo actualizado en el Open LLM Leaderboard de Hugging Face.

    Fine-tuning vs. RAG: cuál elegir según tus datos

    Cuando llega el momento de especializar un SLM para tu negocio, la primera pregunta es: ¿tengo datos suficientes para hacer fine-tuning? Si la respuesta es no —o si tu base de conocimiento cambia con frecuencia—, RAG (Retrieval-Augmented Generation) es la alternativa estándar del sector, y en muchos casos la más pragmática para pymes.

    Cuándo usar RAG en lugar de fine-tuning

    RAG combina el SLM con un sistema de recuperación de documentos: en lugar de «memorizar» el conocimiento durante el entrenamiento, el modelo consulta en tiempo real una base de documentos (PDFs, páginas web, FAQs, artículos del CRM) y genera la respuesta basándose en los fragmentos recuperados. El umbral práctico es claro: si tienes menos de 200 pares de pregunta/respuesta históricos, RAG es más fiable que el fine-tuning.

    Las ventajas de RAG para pymes son tres: no necesitas datos etiquetados en cantidad, la base de conocimiento se actualiza sin reentrenar el modelo (basta con añadir documentos al índice) y las respuestas son trazables —puedes ver qué fragmento usó el modelo para responder, lo que facilita detectar errores—. La implementación más accesible combina un SLM local (Mistral 7B o LLaMA 3.2) con un sistema de embeddings como ChromaDB o Weaviate y un orquestador como LangChain o LlamaIndex.

    Cuándo el fine-tuning sigue siendo la mejor opción

    El fine-tuning tiene sentido cuando necesitas que el modelo adopte un tono de voz muy específico, cuando las respuestas deben seguir un formato estructurado preciso (por ejemplo, respuestas JSON para integraciones) o cuando tienes más de 500 ejemplos de alta calidad y el dominio es estable. En esos casos, un modelo afinado supera sistemáticamente a RAG en velocidad de inferencia y consistencia de formato.

    ¿Cómo hacer fine-tuning de un SLM con tus propios datos?

    El fine-tuning convierte un modelo genérico en una herramienta útil para tu negocio. Con las herramientas actuales, el proceso está al alcance de cualquier desarrollador con conocimientos básicos de Python, sin necesidad de hardware especializado ni de un equipo de data science.

    La combinación más accesible para pymes es Unsloth con adaptadores LoRA (Low-Rank Adaptation). Unsloth reduce los requisitos de VRAM y el tiempo de entrenamiento a la mitad; LoRA puede igualar el rendimiento del fine-tuning completo usando 4 veces menos VRAM. Esto significa que puedes afinar un modelo de 3-7B parámetros en una GPU de consumo (16 GB de VRAM) o en Google Colab de forma gratuita. Unsloth soporta fine-tuning para Llama 4, Gemma 3, Phi 4, Mistral y Qwen 2.5.

    Flujo de trabajo paso a paso

    1. Prepara el dataset. Necesitarás al menos 500-1000 pares de consulta/respuesta exportados de tu CRM o sistema de tickets. Si no llegas a ese volumen, considera RAG (ver sección anterior). La calidad es más importante que la cantidad: elimina ejemplos desactualizados, tóxicos o ambiguos.
    2. Elige el modelo base y carga con cuantización 4-bit. Para tareas de clasificación o respuesta corta, Phi-4 Mini o LLaMA 3.2 3B son buenas opciones. Se recomienda empezar con QLoRA, uno de los métodos más accesibles y efectivos para entrenar modelos en hardware limitado.
    3. Configura los hiperparámetros clave. Entre 1 y 3 épocas de entrenamiento; más de 3 aumenta el riesgo de sobreajuste. El rango de LoRA rank más habitual está entre 16 y 64. Para SLMs con LoRA, el learning rate es el hiperparámetro más influyente; un punto de partida seguro es 2e-4.
    4. Entrena y evalúa. Con un dataset de 500-1000 ejemplos y un modelo de 3B parámetros, el entrenamiento suele completarse en 30-90 minutos en una GPU T4 de Colab. Monitoriza la pérdida de validación: si empieza a subir mientras la de entrenamiento baja, hay sobreajuste.
    5. Valida la calidad en producción. La pérdida de validación mide el ajuste técnico, pero no si el modelo es útil en el mundo real. Usa estas métricas complementarias: F1-score para tareas de clasificación (intención, sentimiento); evaluación humana por muestreo —revisa manualmente una muestra del 5-10% de las respuestas generadas cada semana—; y tasa de alucinaciones, es decir, respuestas que el modelo inventa sin base en el contexto. Para detectar alucinaciones, compara las respuestas del modelo con los documentos fuente o con las respuestas históricas del equipo humano. Si el modelo responde preguntas fuera de su dominio con confianza, añade una capa de guardrails (filtros de intención) antes de la inferencia. Reentrenar cuando la tasa de escalado al agente humano supere el umbral definido o cuando el negocio incorpore productos, políticas o servicios nuevos.
    6. Despliega con Ollama. Exporta el modelo afinado en formato GGUF y cárgalo en Ollama para exponerlo como API local. Desde ahí, conecta con tu stack de marketing tal como se describió en la sección de integración.

    ¿Cómo empezar a implementar SLMs en tu empresa?

    Implementar modelos de lenguaje pequeños en marketing no requiere un equipo de data science ni una infraestructura compleja. El camino más directo para una pyme pasa por tres fases.

    1. Define el caso de uso más acotado posible. No empieces por «automatizar toda la atención al cliente». Empieza por «responder automáticamente las 15 preguntas más frecuentes sobre envíos». Cuanto más específico, mejor funcionará el modelo.
    2. Elige el modelo y la herramienta de despliegue. Para la mayoría de pymes, Ollama + un modelo de 3-7B parámetros es suficiente para empezar. No necesitas GPU de alto rendimiento para tareas de clasificación o respuestas cortas.
    3. Decide entre fine-tuning y RAG según tus datos. Si tienes más de 500 pares históricos y un dominio estable, el fine-tuning con LoRA es la opción más potente. Si no llegas a ese volumen o tu base de conocimiento cambia con frecuencia, RAG te dará resultados más rápidos y mantenibles.

    La clave está en no intentar resolver todo a la vez: un SLM bien afinado para una tarea concreta aporta más valor que un modelo generalista mal configurado para diez. La implementación progresiva es la estrategia que genera resultados más rápidos y sostenibles.

    Preguntas frecuentes sobre SLMs en marketing

    ¿Cuál es la diferencia entre un SLM y un LLM para uso en marketing?

    Un LLM (Large Language Model) como GPT-4 tiene cientos de miles de millones de parámetros, es generalista y requiere infraestructura costosa o APIs de pago. Un SLM tiene entre 1B y 7B parámetros, se especializa en tareas concretas y puede ejecutarse en hardware estándar. Para marketing y atención al cliente, donde las tareas son repetitivas y acotadas, un SLM bien afinado suele ser más eficiente y económico que un LLM generalista. Los SLMs en marketing ofrecen así una relación coste-rendimiento difícilmente igualable para las pymes.

    ¿Los chatbots con SLMs pueden reemplazar completamente a los agentes humanos?

    No completamente, ni es el objetivo. Los chatbots con SLMs son más eficaces como primer filtro: resuelven consultas frecuentes, clasifican intenciones y derivan los casos complejos al agente adecuado. La automatización de atención al cliente con SLMs libera a las personas para las interacciones que realmente requieren criterio, empatía o autorización. Los SLMs en marketing de atención al cliente son una herramienta de apoyo, no de sustitución.

    ¿Es complicado desplegar un SLM para análisis de sentimiento local?

    Con herramientas actuales como Ollama o Hugging Face Transformers, el despliegue básico está al alcance de cualquier desarrollador junior o técnico con conocimientos de Python. El análisis de sentimiento local con modelos como LLaMA 3.2 o Mistral 7B puede configurarse en pocas horas. El trabajo más importante es preparar los datos de entrenamiento o los ejemplos de few-shot para que el modelo clasifique correctamente en tu contexto específico. Los SLMs en marketing de análisis de sentimiento son, en este sentido, una de las aplicaciones más accesibles para empezar.

    ¿Qué presupuesto necesita una pyme para implementar modelos ligeros?

    El coste de infraestructura puede ser mínimo: muchos SLMs de 3-7B parámetros funcionan en un servidor con 16 GB de RAM o en una GPU de consumo. El coste real está en el tiempo de configuración y afinamiento. A diferencia de las APIs de LLMs de pago, no hay coste por consulta, lo que hace que el retorno de inversión sea especialmente atractivo para empresas con alto volumen de interacciones repetitivas. Esta estructura de costes fijos es uno de los argumentos más sólidos a favor de los SLMs en marketing frente a las alternativas basadas en API.

  • AI for SMEs: assessment, budget and first steps (2025)

    AI for SMEs: assessment, budget and first steps (2025)

    Artificial intelligence is no longer the exclusive territory of large corporations. Today, AI for SMEs is an accessible reality and, in many cases, the difference between growing or falling behind. The real problem is not the technology itself, but knowing where to start: what to assess, how much to budget and how to launch a first project without putting the business at risk.

    This guide answers exactly those questions. You will find a clear AI needs assessment process, real budget ranges for the Spanish context and a step-by-step pilot plan that any manager can apply, even without technical training. Artificial intelligence for small and medium-sized enterprises is no longer a future option: it is a present-day tool.

    Why is AI for SMEs a priority right now?

    For years, artificial intelligence was synonymous with million-euro projects and data teams that few companies could afford. That has changed radically. Projects that three years ago cost between €50,000 and €100,000 are implemented today for €2,000–€8,000, thanks to the rise of no-code tools and language model (LLM) APIs that are billed by usage. AI for SMEs has therefore become financially viable for almost any business.

    According to the Survey on ICT use and e-commerce by the INE (2024 edition), 21.1% of Spanish companies with ten or more employees already use artificial intelligence, eight percentage points more than the previous year. However, among SMEs with lower digital maturity, the real use of AI for small businesses remains very low. Those who move now are still early and can build a competitive advantage before mass adoption levels the playing field.

    Furthermore, AI for SMEs not only reduces costs: it allows competing in capabilities that previously required much larger teams. Automating customer service, generating content, analysing sales data or prioritising leads are tasks that a team of five people can execute today with the right tools. Artificial intelligence for SMEs thus opens up a range of possibilities that was previously reserved for large corporations.

    How to assess whether your SME needs AI?

    Before talking about tools or budget, the AI needs assessment is the most critical step. Many SMEs fail in their first AI projects not because the technology fails, but because they automate the wrong process. The company’s digital maturity — its current level of digitalisation — directly determines what type of solution makes sense to tackle first. That is why any AI roadmap for SMEs must begin with this diagnosis.

    Identify your real pain points

    The starting point is a simple question: what task consumes the most time from your team without generating differential value? Applying AI for SMEs only makes sense when it is aimed at solving a specific and measurable problem. Some common examples in Spanish SMEs:

    • Repetitive customer service: always answering the same questions by email or chat.
    • Content generation: writing product sheets, posts or periodic reports.
    • Lead classification and prioritisation: manually deciding who to call first.
    • Document processing: extracting data from invoices, orders or contracts.
    • Sales data analysis: building reports that could be generated automatically.

    For each pain point, estimate how many weekly hours it consumes and what that time costs. That calculation is the basis of any subsequent AI ROI analysis. In the context of SME digital transformation, this exercise often reveals savings opportunities much greater than expected.

    Apply the feasibility filter

    Not every process deserves to be automated with AI. Before moving forward, check that the candidate process meets these three conditions:

    1. It is documented: if there is no clear procedure, AI will amplify the chaos instead of resolving it.
    2. It has sufficient volume: automating something that happens twice a month rarely justifies the investment.
    3. Its data is accessible: AI needs information to learn or to act; if the data is on paper or in silos, the preparation cost skyrockets.

    If the process passes this filter, you have a solid candidate for your first AI pilot for SMEs. If it does not, do not discard it: document the process first and reassess it in three months. Robotic process automation (RPA) can be a useful prior step to structure workflows before incorporating artificial intelligence.

    How much does it cost to implement AI in an SME?

    The question about AI budget and ROI is the one that most paralyses managers. The honest answer is that the range is wide, but there is a clear structure depending on the type of solution chosen. Knowing these ranges is essential for planning AI adoption for SMEs realistically.

    Budget ranges for AI in SMEs (Spain, 2025–2026)
    Solution type Initial investment Recurring cost Ideal profile
    SaaS with integrated AI €0 – €500 €50 – €300/month SMEs that want to start without risk
    Low-code automation €2,000 – €8,000 €200 – €800/month SMEs with defined processes and some data
    Custom development €8,000 – €30,000 €600 – €2,500/month SMEs with specific needs and high volume

    For most SMEs taking their first steps with AI, the smartest entry point is the low-code automation layer: platforms such as Make, Zapier or n8n combined with LLM APIs allow building sophisticated workflows without needing an in-house development team. This layer is where AI for SMEs offers the best ratio between investment and results.

    How to calculate AI ROI before investing?

    Calculating AI ROI does not need to be complex. A simple formula for an SME is: (hours saved per month × employee hourly cost) – monthly cost of the solution. If the result is positive in less than twelve months, the project makes financial sense.

    For example: if a lead classification process consumes fifteen weekly hours from a sales rep at a cost of €25/hour, the monthly cost of that task is approximately €1,500. An AI solution for SMEs that automates 70% of that work and costs €300/month generates a net saving of more than €700/month. The return on an initial investment of €5,000 is reached in less than seven months.

    Grants and subsidies for AI in Spanish SMEs

    The real cost of implementing AI for SMEs in Spain is significantly lower than the list price when available funding channels are leveraged. These are the main options in force in 2025–2026:

    • Kit Digital: grant of up to €12,000 for SMEs with between 3 and 49 employees, and up to €6,000 for micro-enterprises with 0 to 2 employees. It funds automation solutions, applied AI and customer management through accredited digitalisation agents. Applications are managed through Acelera Pyme.
    • Tax deductions for technological innovation (Corporate Tax): companies that document their AI project as technological innovation can deduct 12% of the investment from Corporate Tax. For R&D the percentage rises to 25%. The key is to document the project correctly from the outset.
    • CDTI (Centre for the Development of Technology and Innovation): offers participating loans and grants for innovation projects with a technological component. Amounts range from €25,000 to several million for consortium projects. More information at cdti.es.
    • FUNDAE bonus: team training in AI for SMEs can be fully subsidised through FUNDAE, reducing the real cost of internal training in automation tools and language models to zero.
    • Regional calls: regions such as Catalonia, Madrid or the Basque Country have their own support lines for digitalisation and AI in SMEs with specific deadlines and requirements. Check the business promotion body in your region.

    The most common combination in SMEs with between 5 and 20 employees is Kit Digital for the tool, the tax deduction for custom development and FUNDAE for training. With this combination, the net cost of an €8,000 project can fall below €3,000.

    What affordable AI tools exist for SMEs?

    Affordable AI tools for SMEs presented as modular cards with icons, labels and cost indicators.
    Affordable AI tools for SMEs range from customer service automation to data analysis; many offer freemium plans or free trials.

    Selecting AI solutions for SMEs is one of the most confusing moments in the process, because the market grows faster than the ability to evaluate it. The key is not to choose by popularity, but by fit with the process you want to solve.

    Tool comparison by business area

    The following table covers the most proven options for the two areas where AI for SMEs generates the fastest return: customer service and process automation.

    Comparison of AI tools for SMEs (customer service and automation, 2025)
    Tool Area Indicative price Learning curve Spanish support
    Tidio Customer service From €0/month (free plan) Low Yes (interface and docs)
    Intercom Customer service From €39/month Medium Partial (docs in English)
    Custom solution (OpenAI/Anthropic API) Customer service Variable (pay per use) High Depends on provider
    Make (ex-Integromat) Process automation From €0/month (free plan) Medium Yes (active community)
    n8n Process automation From €0 (self-hosted) Medium-high Spanish-speaking community
    Zapier Process automation From €19.99/month Low Partial (docs in English)

    Beyond these categories, there are proven options for other areas: ChatGPT, Claude or Jasper for marketing and content; Microsoft Copilot in Excel or Google Gemini in Sheets for data analysis with natural language; and Holded or Factorial for management and administration, with AI layers designed specifically for the Spanish SME context.

    Before contracting any new AI tool for SMEs, check whether the ones you already use have activatable AI features. Your CRM, your email marketing platform or your project management tool probably already offer capabilities you are not taking advantage of.

    AI solution selection criteria

    When evaluating AI options for SMEs, apply these four criteria to avoid being swayed by vendor marketing:

    1. Integration with your current stack: a tool that does not connect with your CRM or ERP will create new information silos.
    2. Scalability: design with two or three times your current volume in mind, not today’s volume.
    3. Privacy and compliance: the European AI Act requires registering which decisions are delegated to AI systems; the GDPR continues to apply to any personal data that enters a prompt.
    4. Support and community: a tool with sparse documentation or no support in Spanish multiplies implementation time.

    Real cases: Spanish SMEs already using AI

    Theoretical frameworks are useful, but concrete social proof is what convinces hesitant managers. These three mini-cases illustrate how AI for SMEs generates measurable results in very different sectors:

    Case 1: 8-person accounting firm in Madrid

    A labour and accounting firm with eight employees implemented an automation workflow with n8n and the OpenAI API to process client invoices. The previous process consumed three hours a day from a technician; after the six-week pilot, the time was reduced to twenty minutes of review. Total investment: €4,200 (partially covered by the 12% Corporate Tax deduction). The return was reached in four months. This case demonstrates that AI for professional services SMEs has a direct and quickly quantifiable impact.

    Case 2: fashion e-commerce shop in Barcelona

    A fashion SME with twelve employees and an online store incorporated Tidio with AI to manage post-sale enquiries. Previously, two people spent 40% of their working day answering repetitive questions about sizes, delivery times and returns. With the chatbot trained on their catalogue, 68% of enquiries are resolved without human intervention. The team redirected that time to collection management and personalised attention for VIP customers.

    Case 3: industrial services company in the Basque Country

    An industrial maintenance SME with twenty employees used Make combined with an LLM to automate the generation of technical reports after each visit. Technicians fill in a voice form in the field; the system generates the structured report and sends it to the client in less than two hours. Documentation time per visit went from 45 minutes to 8 minutes. The company was able to take on 20% more contracts without expanding its workforce. It is a clear example of how AI for industrial SMEs can transform operational capacity without increasing the fixed cost structure.

    How to launch an AI pilot step by step?

    The biggest mistake SMEs make when adopting AI is trying to transform everything at once. A scoped pilot, with a specific process and clear metrics, is the safest way to validate value before scaling. This is the process we recommend at Amara, marketing engineering, to the clients we accompany in their first AI projects for SMEs.

    Weeks 1–2: diagnosis and use case selection

    Define the candidate process using the feasibility filter described above. Document the current workflow in detail: who does what, how long it takes and what data is handled. Measure the initial state (time per task, error rate, team satisfaction) so you can compare afterwards. This diagnosis is the essential starting point in any well-executed AI project for SMEs.

    In this phase you should also assess which tools in your current stack already have integrated AI. Many times the first AI pilot for SMEs does not require contracting anything new, only activating features that are already available.

    Weeks 3–6: implementation and measurement

    Implement the chosen solution in a specific department or process, not across the entire company. Measure before and after: time per task, errors made, volume processed and team satisfaction. These data are what will justify the investment to management and what will guide the decision to scale. In AI for SMEs, pilot data is the most powerful argument for convincing internal sceptics.

    During this phase, involve the team from the outset. Resistance to change is one of the main obstacles in AI adoption for SMEs, and it is drastically reduced when the people who use the tool participate in its configuration and feel that AI is removing tedious work from them, not their jobs.

    Weeks 7–10: training and adjustment

    With the first pilot data in hand, train the team in the advanced use of the tool. In Spain, AI training for SMEs can be subsidised through FUNDAE, which reduces the real cost of this phase. Include prompt engineering as a transversal competency: knowing how to give clear instructions to a large language model (LLM) is today as useful as knowing how to use a spreadsheet.

    Also use this phase to document the AI project for SMEs as technological innovation, which can give access to the 12% Corporate Tax deduction.

    Weeks 11–12: scale and document

    If the pilot data is positive, extend the solution to other departments or processes. Document the learnings: what worked, what adjustments were necessary and what metrics the project improved. This documentation is the most valuable asset for the next AI adoption cycle in your SME, and the foundation on which to build a more ambitious digital transformation strategy.

    What mistakes to avoid in AI implementation?

    Knowing the most common mistakes saves time and money. These are the ones we see most frequently in SMEs approaching AI for small and medium-sized enterprises for the first time:

    • Automating without a documented process: AI amplifies what already exists; if the process is chaotic, automation will make it more chaotic and faster.
    • Ignoring hidden costs: integration with existing systems, team training, maintenance and updates can represent between 15% and 25% of the initial annual cost.
    • Budgeting only for current volume: design the solution for two or three times your current volume from the outset; scaling afterwards is more expensive than scaling from the design.
    • Choosing the tool before the problem: the selection of AI solutions for SMEs must start from the process to be solved, not from the most popular tool on LinkedIn.
    • Ignoring regulatory compliance: the European AI Act and the GDPR apply from day one; it is not something to be managed “when the project is mature”.
    • Not documenting the project as innovation: many SMEs lose the 12% Corporate Tax deduction simply by not correctly recording the technological nature of the project from the outset.

    How to know if your SME is ready to take the step?

    SME AI readiness assessment diagram with decision points, data icons, team and budget.
    The AI needs assessment must consider data maturity, team capabilities and available budget; not all SMEs require the same solution.

    Digital maturity is not a prerequisite for starting with AI for SMEs, but it does determine the entry point. If your company still manages key processes on paper or in unstructured spreadsheets, the first step is to digitalise those processes before automating them. AI needs accessible data to generate value; without that foundation, even the best large language models produce inconsistent results.

    On the other hand, if you already use a CRM, an email marketing platform or an ERP, you probably have the minimum infrastructure to launch a first AI pilot for SMEs in less than six weeks. The level of digital maturity determines the type of solution, not the possibility of starting.

    At Amara, marketing engineering, we work with SMEs at different points in their digital transformation. From the initial diagnosis to the design and implementation of AI solutions for SMEs adapted to the size, sector and budget of each company. The first step is always the same: understand what problem you want to solve before talking about technology.

    Conclusion: AI for SMEs is not the future, it is the present

    Artificial intelligence for SMEs has stopped being a promise and become a real and achievable competitive advantage. The time to start is not when you have more budget or more team: it is now, with a specific process, a scoped pilot and clear metrics that justify the next step.

    The AI needs assessment, budget planning, leveraging available grants and launching a step-by-step pilot are the levers that turn artificial intelligence from an abstract concept into measurable results for your business. AI for SMEs does not require you to be an expert in technology, RPA or LLMs; you need to know what problem you want to solve and have the right methodology to address it.

    Article prepared by the team at Amara, marketing engineering — specialists in digital transformation and AI strategy for Spanish SMEs. Meet the team.

    Frequently asked questions

    How long does it take to implement an AI solution in an SME?

    A well-scoped initial AI pilot for SMEs can be operational in four to six weeks. The full implementation, including team training and adjustments, is usually completed in ten to twelve weeks. More complex custom development projects can extend up to six months.

    Do I need an in-house technical team to implement AI?

    Not necessarily. Low-code tools and SaaS with integrated AI allow implementing AI solutions for SMEs without programming. For more complex projects, you can work with a specialised external provider, such as Amara, marketing engineering, which manages the development and integration for you.

    Are there grants or subsidies to implement AI in Spanish SMEs?

    Yes. In Spain there are several funding channels for AI in SMEs: Kit Digital (for digitalisation with an AI component), tax deductions for technological innovation in Corporate Tax, and specific calls from bodies such as the CDTI. In addition, team training in AI for SMEs can be subsidised through FUNDAE.

    What happens to my company’s data privacy if I use AI tools?

    The GDPR continues to apply to any personal data that enters an AI system for SMEs. Before choosing a tool, identify what data will be processed and verify that the provider complies with European regulations. The AI Act adds the obligation to register which decisions are delegated to AI systems and to classify the risk level of the project.

    Where is it best to start if my SME has a very limited budget?

    Start with the tools you already use: many CRMs, email platforms and office suites already include AI features for SMEs that can be activated at no additional cost. If you need to go further, the freemium versions of tools such as ChatGPT, Make or Tidio allow you to validate results before committing budget.

    Sources